

TradingView Renko backtests can produce unrealistic results because simulated trades use synthetic brick prices. Those prices may not have been available when an order could execute. To assess a Renko strategy, document its construction settings, inspect individual simulated trades and compare timestamped forward signals with broker records.
Table of Contents
- Begin with the chart construction
- Inspect individual simulated trades
- Why Renko results change with the chart interval
- Compare live signals with the historical chart
- A hypothetical mismatch to work through
- Does the standard-OHLC option work for Renko?
- What a useful automation handoff contains
- Frequently asked questions
- Does this mean Renko charts have no use?
- Will using the smallest available interval solve the problem?
- What is the best Renko brick size?
- Can I compare a shared Renko preset with my own results?
TradingView explicitly warns that strategies on non-standard charts can produce results that do not represent real market conditions. On Renko charts, simulated orders use the synthetic price levels of the bricks. That makes a visually attractive historical result an insufficient basis for an execution decision. TradingView: unrealistic results on non-standard charts
When someone shares a Renko layout, request the settings and intended signal timing with it. A shared layout lets you reproduce a display. Assessing the strategy also requires knowing how its historical orders were priced.
Begin with the chart construction
Renko charts organize movement into bricks rather than drawing one conventional candle for every equal time interval. In TradingView, the selected construction method and underlying interval matter. A screenshot showing only the strategy name omits settings needed to understand what the chart represents.
TradingView’s guide describes brick sizing methods and realtime projection bricks. Those projections represent potential bricks before the source interval has completed. They should not be treated as equivalent to a settled historical record merely because they are visible on screen. TradingView: understanding Renko charts
Ask the person sharing a setup to provide the exact symbol, chart interval, Renko method, sizing inputs, price source and script version. Keep a screenshot of the settings beside the shared link. That makes it possible to distinguish an actual configuration mismatch from a disagreement about how the same configuration behaves.
Inspect individual simulated trades
Choose a small set of historical trades for review before looking for the best-performing stretch. Include an ordinary entry, a reversal and an exit near a fast move. The choice is a diagnostic sample, not an estimate of a strategy’s future success rate.
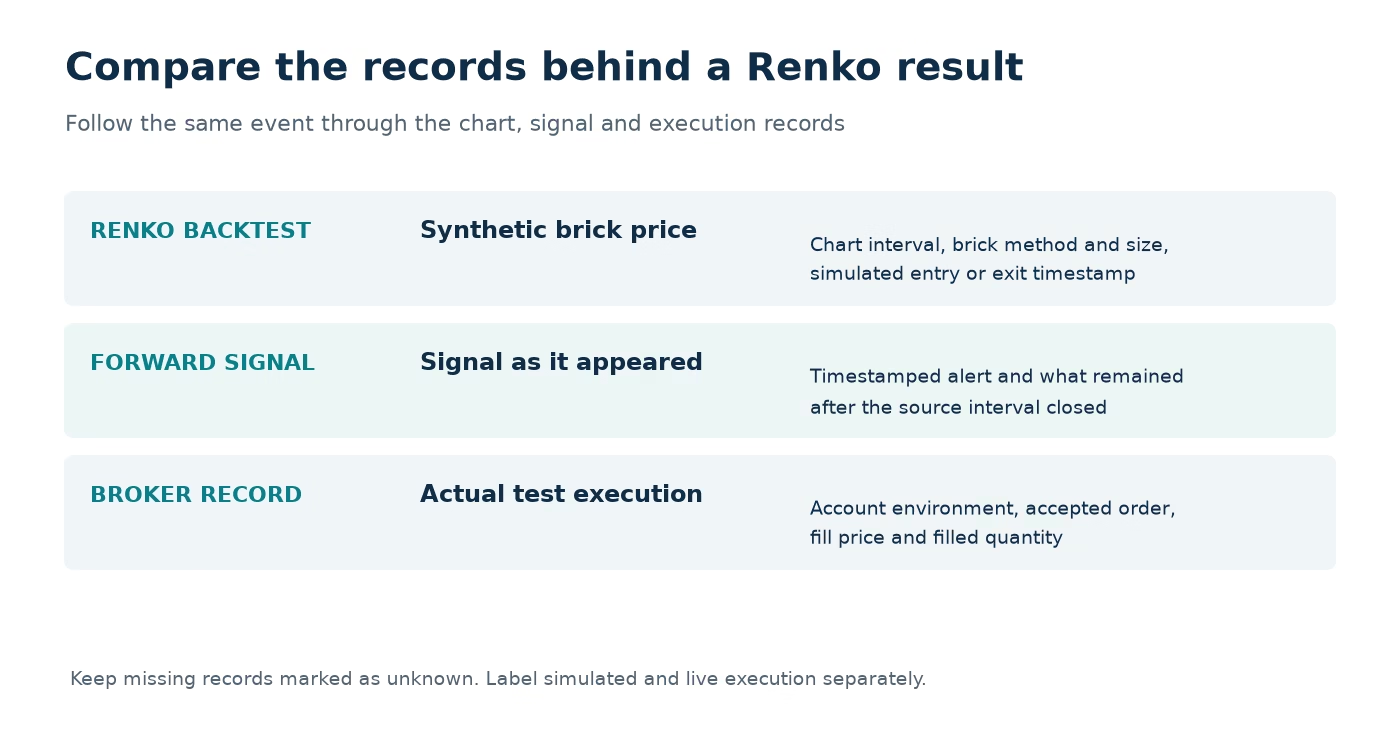
For each selected trade, record the information below. Leave a field unknown when the source does not establish it. Do not fill the gap with a price inferred from a brick.
| Field | What to capture | What it helps answer |
|---|---|---|
| Strategy event | Entry or exit with its historical timestamp | Which event is being audited? |
| Synthetic price | Price shown by the strategy report | What did the simulation assume? |
| Chart configuration | Method, size, source and interval | Can the display be reproduced? |
| Underlying market observation | Available standard-chart data for the same period | What comparison data exists? |
| Realtime signal evidence | A preserved alert or observation, if available | Was the event observed as it happened? |
| Broker evidence | Order status and fill, if a permitted test was actually run | What happened in execution? |
Do not call a historical marker an alert log. Do not call a plausible market price a fill. Keeping those evidence types separate is the central safeguard in this review.
Why Renko results change with the chart interval
TradingView explains that the chart interval controls the finest source detail used to construct historical Renko bricks. Deeper history can use higher-timeframe information when finer data is unavailable. This means a long historical view and a recent detailed view need not be built from equivalent source granularity. TradingView: Renko recalculation and historical data
Record the interval before and after every comparison. If one person shares a 15-second setup and another opens it at five minutes, do not compare their headline results as though only their trading skill changed. Start by establishing that the inputs describe the same experiment.
A smaller interval still needs the same execution review. More detailed construction and real order fills remain different questions. Review the assumptions behind each selected entry even after the two displays agree.
Compare live signals with the historical chart
Choose a fixed configuration and a predetermined observation window. Record the symbol, Renko settings, script version and signal rules before the window starts. Avoid changing brick size whenever an unfavorable result appears. That makes the record impossible to interpret as one configuration.
Observe when a candidate brick appears, whether a signal appears with it, and what remains after the relevant source interval completes. If the script also requests higher-timeframe data, review its Pine Script lookahead handling. A correct Renko configuration does not resolve a separate future-data leak. Save the original record before refreshing or reloading the chart. When reviewing later, compare the same timestamped event instead of comparing two broad screenshots from different moments.
Your log might say: “A candidate signal was visible at this time. No alert record was captured,” or “An alert was recorded at this time. The later historical chart shows this marker.” Those are useful, bounded observations. Neither requires guessing what the strategy would have done in an unobserved live session.
If you also run an authorized simulated execution test, append its order and fill records as a separate layer. Make the account environment explicit. A simulated fill is evidence about that test environment, not a promise of an identical live-market result.
A hypothetical mismatch to work through
Imagine a Renko report shows an entry at 100.00. Your contemporaneous observation records the source signal at a time when the available market quote was 100.30. These numbers are invented to illustrate the audit.
First preserve both timestamps and identify what each number represents. The historical entry may be a synthetic price. The observation may be a quote, not an executable fill. Neither should silently replace the other in a performance calculation.
Then ask the strategy developer how the historical event and the realtime signal are intended to correspond. If an actual test order exists, examine its accepted and filled states separately. The useful outcome is a clear account of the event sequence, including missing evidence, rather than choosing whichever number produces a more attractive result.
A report presented to a trading partner should label historical synthetic results, forward signal observations and execution results separately. That makes it possible to discuss the setup without overstating what has been tested.
If the discrepancy continues beyond chart construction into alert delivery or order handling, use the broader backtest, alert and live-trade comparison guide. Keep the Renko configuration record attached so that the later investigation does not lose the source-chart context.
Does the standard-OHLC option work for Renko?
TradingView documents a standard-OHLC fill option for strategies on Heikin Ashi charts. Its explanation relies on the relationship between Heikin Ashi bars and standard time-based bars. That is a specific feature, not a general switch that makes every non-standard chart’s simulated fills realistic.
If someone suggests enabling a fill option as a Renko fix, ask for the official documentation showing that it applies to Renko. Do not infer support from a setting that belongs to another chart type. Similarly, a screenshot of a checkbox does not explain which prices a particular strategy used in an earlier saved report.
What a useful automation handoff contains
Before handing a Renko setup to an execution specialist, provide the configuration record, the intended signal timing, selected historical trade inspections and the forward observation log. State which parts were observed and which remain unknown.
PickMyTrade’s role in a compatible workflow is downstream of signal generation. Routing an alert does not convert synthetic historical fills into observed market executions. Keep the source signal, routing event, broker acceptance and broker fill identifiable in any automation review.
Use PickMyTrade’s alert and order troubleshooting guide to keep the delivery record and the broker result connected. Ask the specialist to verify the destination account and instrument independently of the chart. If a prop account is involved, verify that account’s applicable permissions as well. A shared chart or a technically supported route does not establish permission to run the strategy on every account.
The decision to proceed should be based on the evidence your process requires. If the only evidence is a synthetic historical equity curve, the missing work is validation of the signal and execution assumptions. A larger position size or a different bridge does not supply that missing evidence.
Frequently asked questions
Does this mean Renko charts have no use?
No. This guide addresses the interpretation of historical strategy fills and the handoff to automation. A trader can use a chart as an analytical representation while remaining explicit about what its prices and signals do, and do not, establish.
Will using the smallest available interval solve the problem?
It changes the source detail available for construction. It does not make a synthetic brick price an actual broker fill. Keep the interval in the record and inspect the event sequence separately.
What is the best Renko brick size?
There is no supported universal answer in these sources. Choose a configuration for a stated research question, preserve it during observation and assess it using a process that acknowledges the chart’s construction. Do not select a size solely because it creates the most attractive historical report.
Can I compare a shared Renko preset with my own results?
Yes, once the symbol, construction method, size, source, interval and script version are documented. Compare a few exact events first. Agreement on a headline profit number is weaker evidence of reproducibility than agreement on the configuration and the events that generated it.
Connect your alerts with PickMyTrade — automated trade execution, no coding required. Start free →