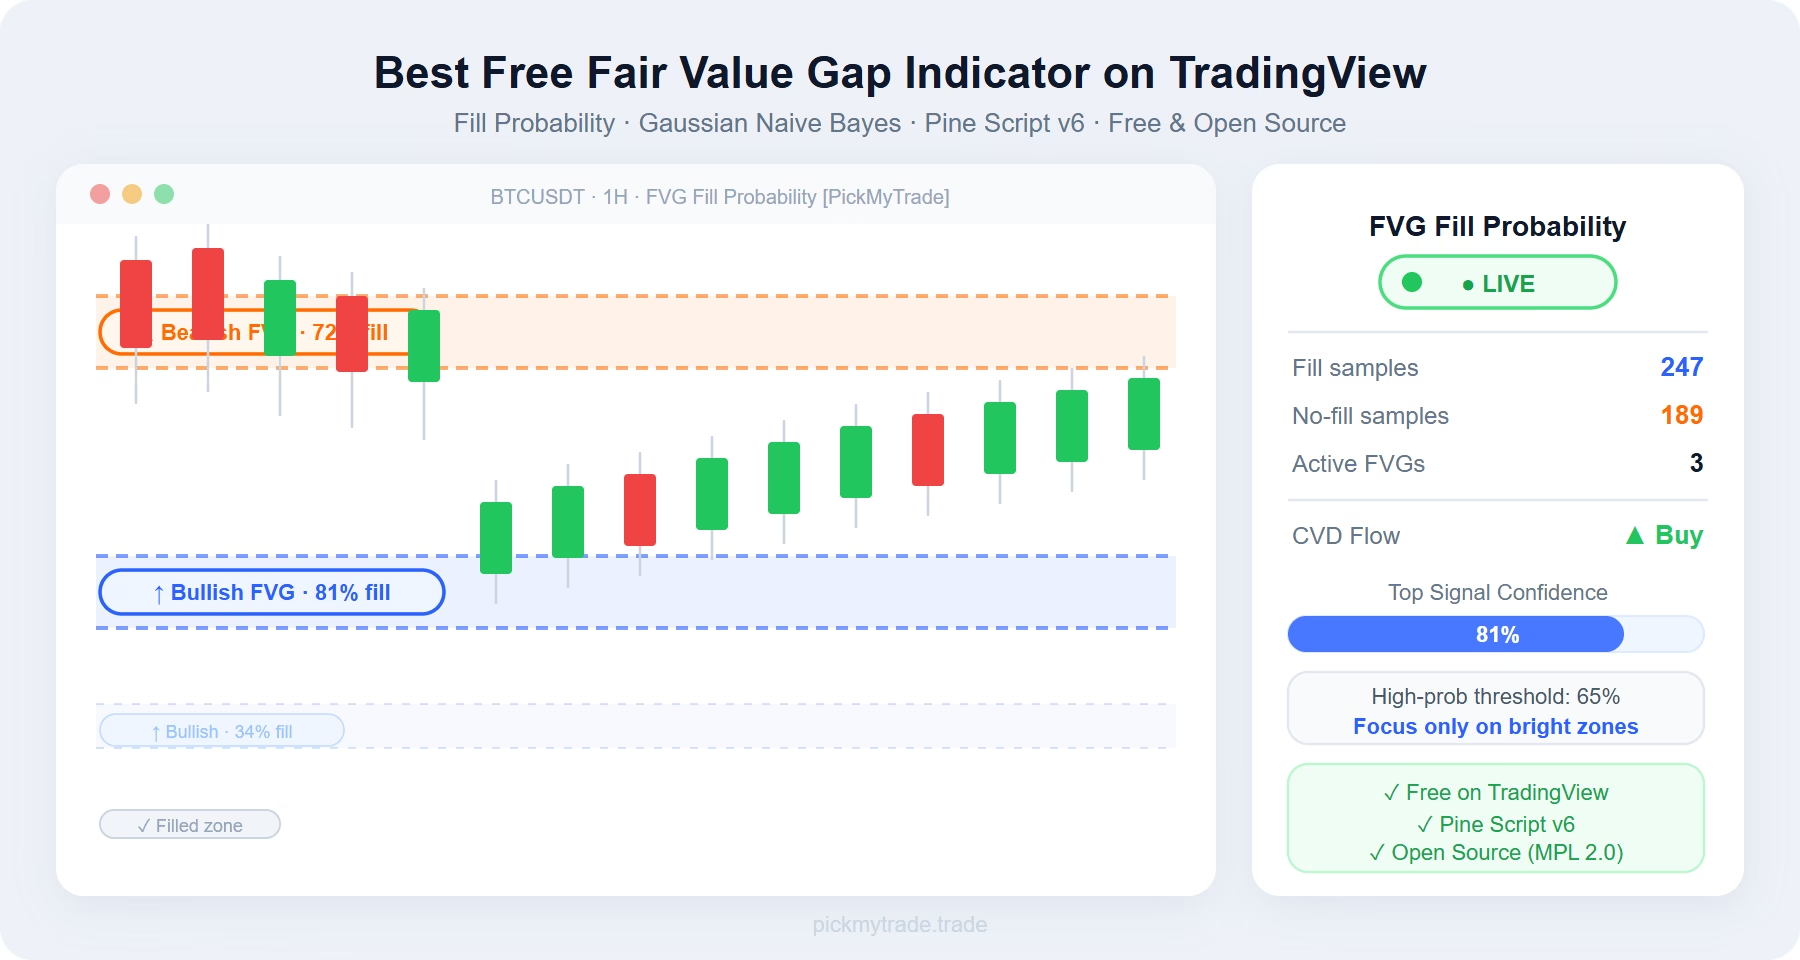
The fair value gap indicator from PickMyTrade is the only free tool on TradingView that tells you which FVG zones are likely to fill before price gets there — using a Gaussian Naive Bayes classifier trained continuously from your chart’s own gap history.
Table of Contents
- What Is a Fair Value Gap (FVG)?
- The Three Classifier Features
- F1 — CVD Momentum
- F2 — Gap Geometry
- F3 — Time-at-Price
- The Gaussian Naive Bayes Classifier
- Learning from History
- Welford Online Learning
- Bayesian Posterior
- What You See on the Chart
- Probability-Shaded Zones
- Live Probability Labels
- The Info Table (Top Right)
- Key Settings
- How to Use the Fair Value Gap Indicator in Your Trading
- Limitations of This Fair Value Gap Indicator
- You May Also Like
- Frequently Asked Questions
- Is this fair value gap indicator really free?
- Does the fair value gap indicator repaint?
- Does it work on crypto and forex?
- How long does warmup take?
- Can I change the colours?
- Get the Indicator
Key Takeaways
- Not all FVGs fill — this free fair value gap indicator uses Gaussian Naive Bayes to score each gap’s fill probability before it resolves
- Three features drive the classifier: CVD momentum (F1), gap geometry (F2), and time-at-price density (F3)
- The model trains continuously from the chart’s own gap history using Welford’s online algorithm — no fixed lookback buffer
- Zones are colour-coded by probability tier so high-conviction setups stand out instantly
- Built entirely in Pine Script v6, open source under Mozilla Public License 2.0, free to use on TradingView
Most traders treat every Fair Value Gap the same. That’s the problem.
You mark up the zone. You wait for price to return. Half the time it never does.
The issue isn’t the FVG concept — it’s that not all FVGs are equal. A tiny imbalance formed on fading order flow carries very different odds than a large gap created during an aggressive institutional surge. Traditional FVG tools draw the same box regardless.
The Fair Value Gap Fill Probability [PickMyTrade] indicator solves this by asking a fundamentally different question: given what we know about this specific gap’s order flow, size, and price history — how likely is it to actually fill?
The answer comes from a Gaussian Naive Bayes classifier trained continuously from the chart’s own history, built entirely in Pine Script v6, and available free on TradingView.
What Is a Fair Value Gap (FVG)?
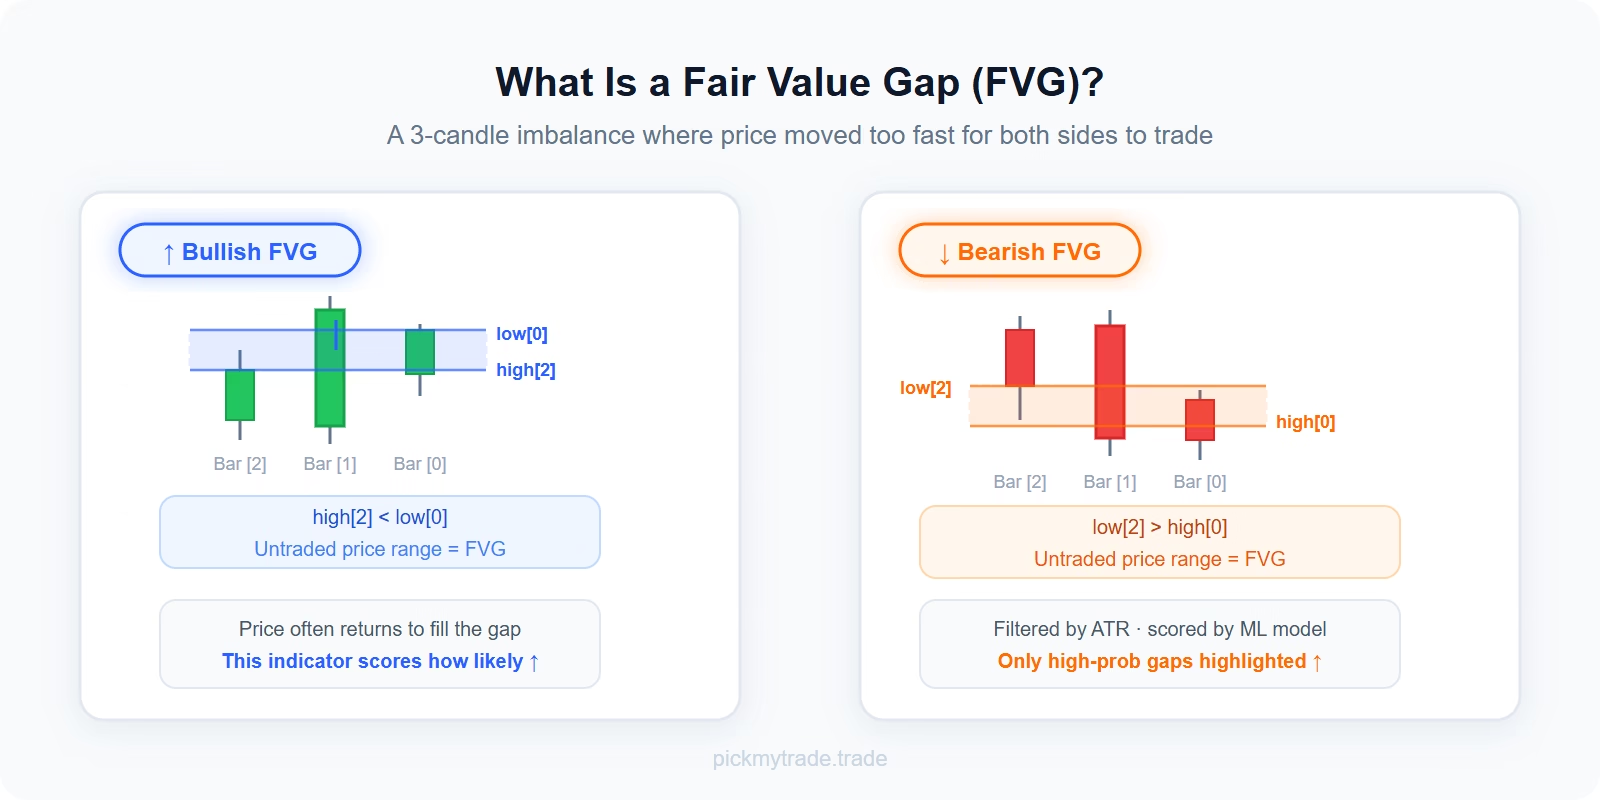
A Fair Value Gap is the three-candle imbalance left behind when price moves impulsively.
- Bullish FVG: The high of two bars ago sits below the current bar’s low — leaving an untraded range between them (
high[2] < low[0]) - Bearish FVG: The low of two bars ago sits above the current high (
low[2] > high[0])
Each gap is detected only on confirmed bar closes (non-repainting), and filtered by a minimum size relative to ATR to ignore noise gaps.
These gaps represent areas where the market moved so fast that no two-sided trading occurred. Price often returns to rebalance them — but not always, and not equally. That’s exactly what this fair value gap indicator is designed to quantify.
The Three Classifier Features
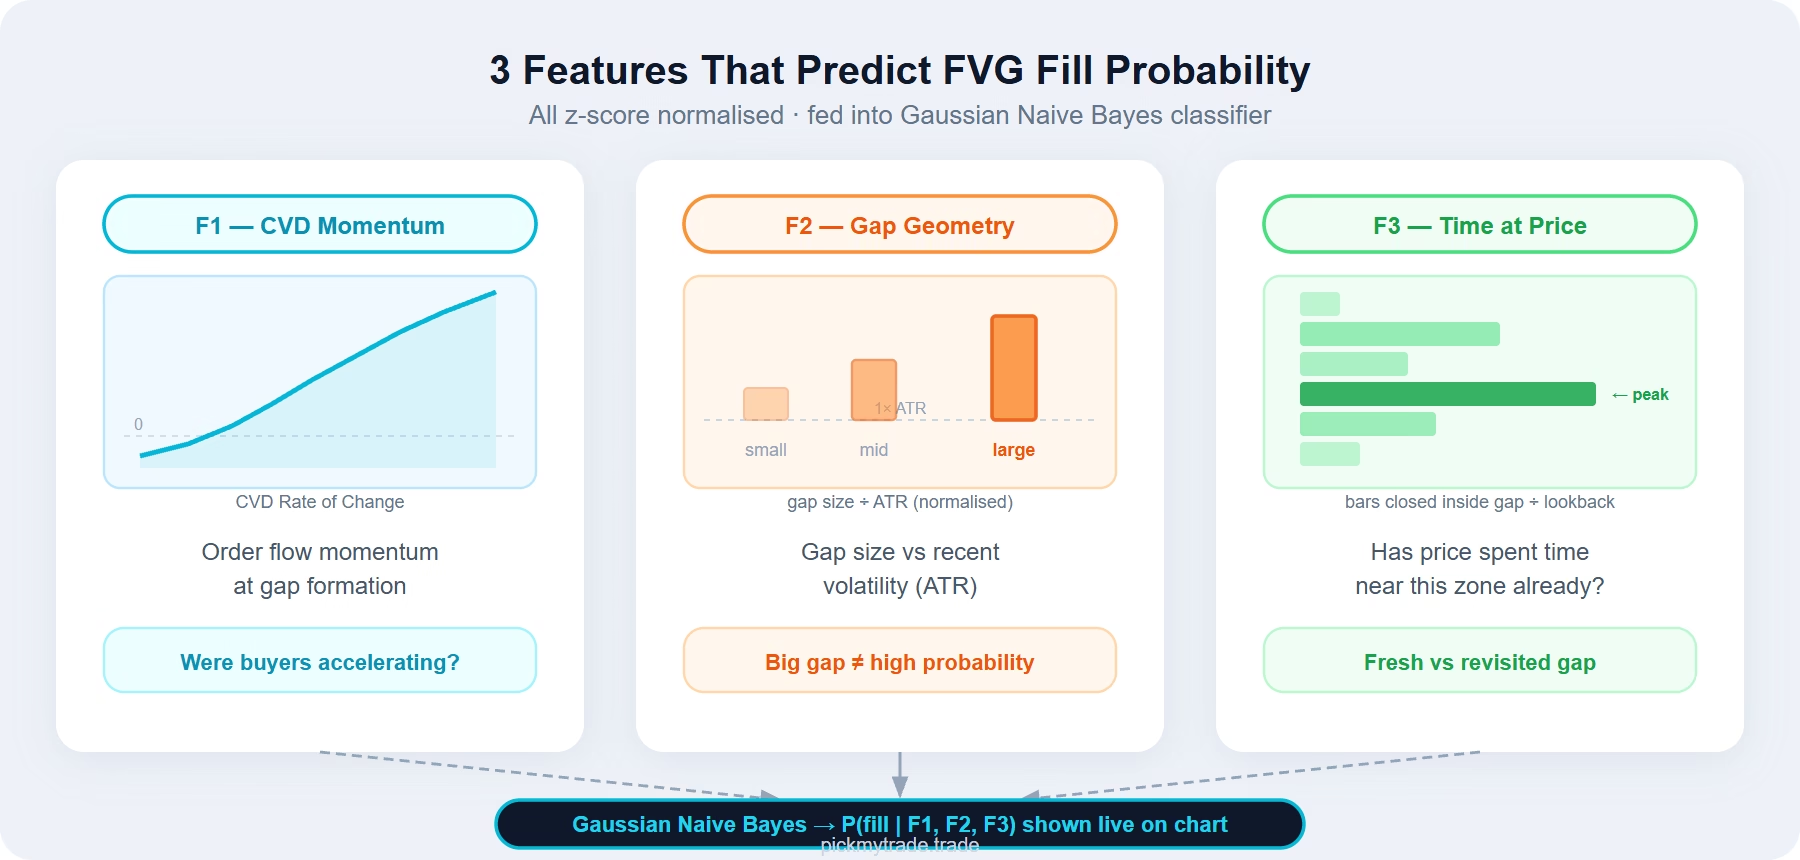
When a gap forms, the classifier records three z-score normalised features:
F1 — CVD Momentum
The rate of change of Cumulative Volume Delta at the moment the gap is created, normalised by its rolling mean and standard deviation. This encodes whether aggressive order flow was accelerating or fading as the imbalance formed.
A gap created while buyers were piling in aggressively carries very different fill odds than one formed during a weak, fading move.
F2 — Gap Geometry
The size of the gap expressed as a multiple of ATR. Larger relative gaps behave differently from small ones, and normalising by ATR makes this feature comparable across instruments and timeframes without manual recalibration.
F3 — Time-at-Price
The fraction of recent bars whose close fell inside the gap’s price band. A zone the market has already spent time near is a fundamentally different proposition from completely untested space.
All three features are standardised using a rolling z-score window so the model isn’t confused by changing volatility regimes.
The Gaussian Naive Bayes Classifier
Learning from History
Every gap eventually resolves one of two ways:
- Fill — price trades back into the zone
- No-fill — the gap survives past the expiry window untouched
Each resolved gap becomes a labelled training example. The classifier learns from the chart’s own history, continuously.
Welford Online Learning
Instead of storing arrays of past data (which would hit Pine Script memory limits), the indicator keeps only running sufficient statistics — count, mean, and sum of squares — for each feature under each outcome class. These update using Welford’s numerically stable online algorithm every time a gap resolves.
Bayesian Posterior
For each live gap, the classifier computes:
- Likelihood of observing F1, F2, F3 given the gap fills (Gaussian distribution fitted to past fill examples)
- Likelihood given it does not fill
- Combined with empirically-updated class priors via Bayes’ theorem
- Result: P(fill | F1, F2, F3) — a posterior probability between 0 and 1
A warmup gate prevents probabilities from displaying until both the fill and no-fill classes have accumulated enough samples (default: 80 each). The info table shows WARMUP until ready, then flips to LIVE.
What You See on the Chart
Probability-Shaded Zones
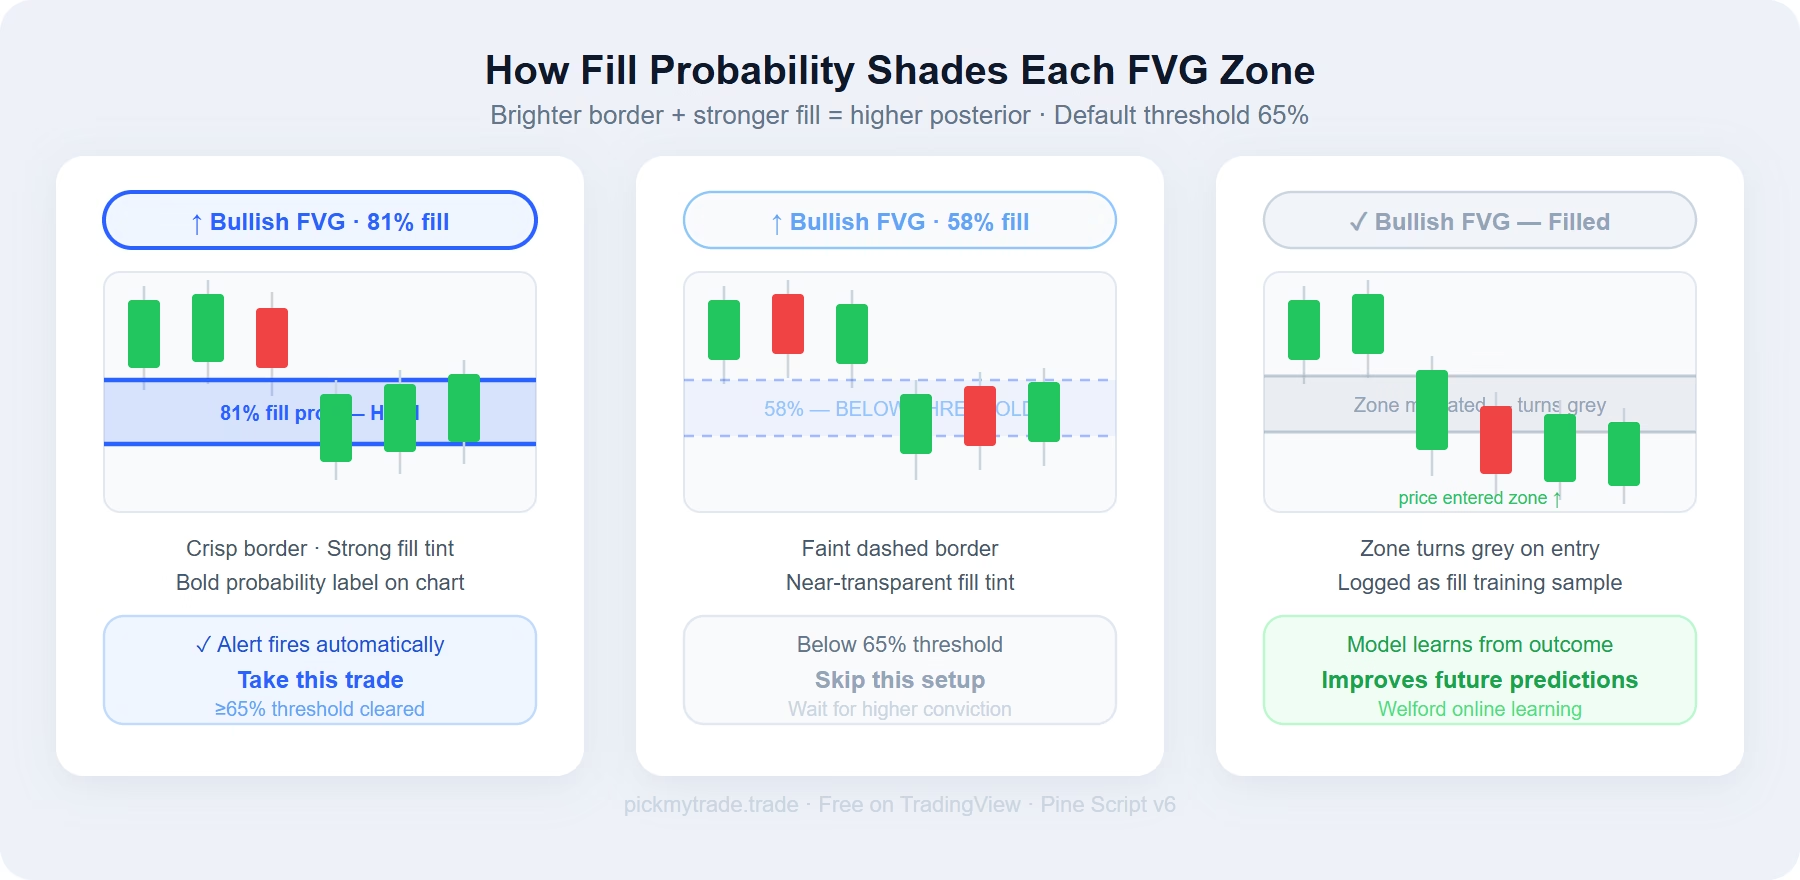
Every active FVG is drawn as a translucent zone with a crisp coloured border. Blue for bullish, orange for bearish. Fill intensity scales across three tiers:
- ≥75% — vivid border, strong fill tint
- 65–74% — clear border, medium fill tint (high-conviction threshold)
- <65% — faint dashed border, near-transparent fill (skip these)
- Filled — turns grey when price re-enters the zone
Live Probability Labels
Each open gap carries a running “X% fill” label that updates every bar. When a gap crosses the high-probability threshold (default 65%), a bold callout fires directly on the chart.
The Info Table (Top Right)
- Fill samples / No-fill samples — training data count
- Active FVGs — currently tracked gaps
- CVD Flow — current order flow direction (▲ Buy / ▼ Sell)
- Status — LIVE or WARMUP
Key Settings
| Setting | What It Does |
|---|---|
| ATR Period | Basis for the minimum gap-size filter |
| Min Gap Size (ATR ×) | Gaps smaller than this multiple are ignored |
| Max Active FVGs | Cap on simultaneously tracked gaps |
| Expire after N bars | Unfilled gaps retire as no-fill samples after this many bars |
| CVD Momentum Period | Lookback for feature F1 |
| Z-Score Window | Normalisation window for all three features |
| Warmup Samples Per Class | Minimum samples before probabilities display |
| High-Prob Threshold | Posterior level that marks a gap as high-conviction |
How to Use the Fair Value Gap Indicator in Your Trading
Focus entries only on ≥65% gaps. Skip low-probability zones entirely, even if they look structurally valid on the chart.
Use the CVD Flow reading as confluence. A bullish FVG showing 70%+ fill probability with active buy flow is a very different setup from one sitting in sell flow.
Let the expiry window train the model. Tune it to match how long gaps tend to stay open in your preferred market and timeframe. The model improves as more gaps resolve.
Set alerts on high-probability signals. Both bull and bear high-probability FVG alert conditions are built in. If you trade futures, you can wire those alerts directly to automated execution — see Best Futures Indicators to Automate for the full setup workflow.
Limitations of This Fair Value Gap Indicator
- CVD is synthetic. Estimated from intrabar price position, not true bid/ask data. Noisier on illiquid symbols.
- Naive Bayes independence assumption. All three features are correlated to some degree — posteriors are best read as relative confidence scores rather than calibrated probabilities.
- Regime dependence. Fill rates vary between trending and ranging markets. The model adapts over time but a sudden regime shift will temporarily degrade calibration.
- Warmup on short charts. The table reads WARMUP until enough gaps resolve. This is by design.
You May Also Like
- Best Futures Indicators to Automate in 2026 — automate your fair value gap indicator signals on Tradovate and other brokers
- TradingView Strategy Research with AI Agents — use AI to backtest and refine indicator-based strategies
- Institutional Order Flow Signals [PMT] — CVD-based Naive Bayes buy/sell signals for any market
- Why ICT & SMC Don’t Work — And What Order Flow Shows Instead
- TradingView MCP with Claude AI — write and test Pine Script indicators with AI in minutes
Frequently Asked Questions
Is this fair value gap indicator really free?
Yes. It is published openly on TradingView under the Mozilla Public License 2.0. No subscription, no invite required.
Does the fair value gap indicator repaint?
No. FVG detection fires only on confirmed bar closes. The classifier uses the features recorded at the time the gap formed — these never change retroactively.
Does it work on crypto and forex?
CVD works reliably on assets with centralised, exchange-reported volume — crypto on major exchanges (Binance, Bybit, CME Bitcoin futures) and equity futures. Spot forex has no centralised volume reporting so CVD approximations are less reliable for FX pairs.
How long does warmup take?
On liquid instruments with active FVG formation (crypto, equity futures), the classifier typically reaches the warmup threshold within the first few hundred bars. On slower instruments or higher timeframes, it takes longer.
Can I change the colours?
Yes. Bull colour and bear colour are both user-configurable inputs. The probability shading tiers automatically adjust relative to whichever colours you choose.
Get the Indicator
Fair Value Gap Fill Probability [PickMyTrade] is live on TradingView. Free · Open Source · Pine Script v6 · Mozilla Public License 2.0
Ready to automate your FVG signals? Connect the indicator to PickMyTrade and execute trades on Tradovate futures directly from your TradingView alerts — no manual order entry, no missed signals.
Connect your alerts with PickMyTrade — automated trade execution, no coding required. Start free →