Introduction: From Data Overload to Actionable Insights
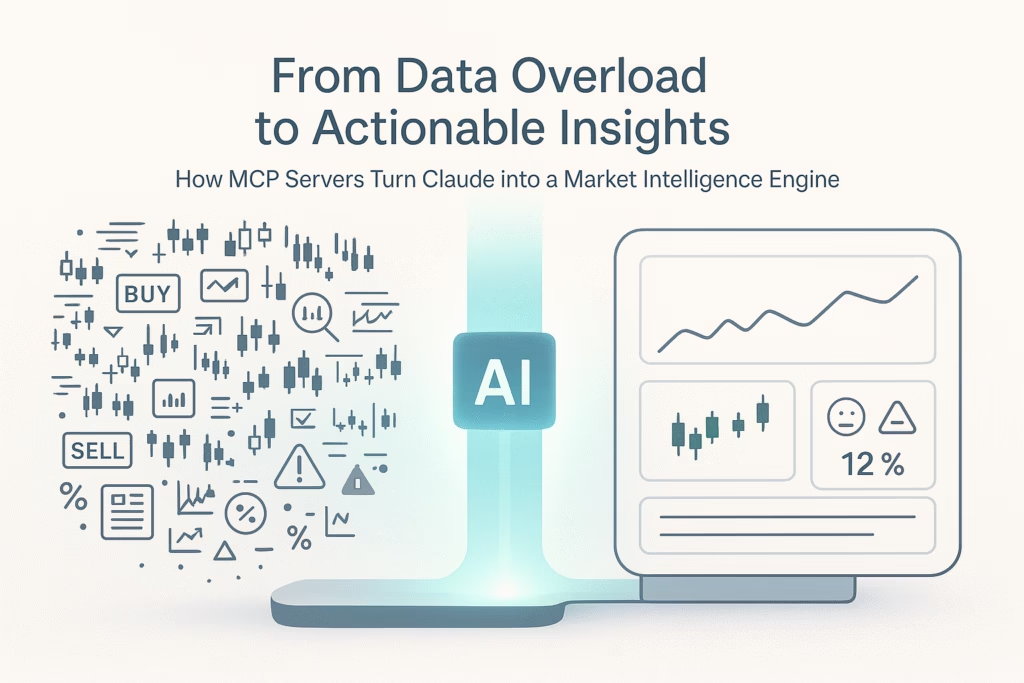
Introduction: From Data Overload to Actionable Insights
Every day, traders face an impossible challenge: thousands of stocks, hundreds of news articles, dozens of technical indicators, and limitless data points. The human brain simply can’t process it all in real-time. Professional traders at hedge funds solve this with teams of analysts and millions in technology infrastructure.
But what if you could have that same analytical power in a conversation with an AI assistant? That’s exactly what MCP (Model Context Protocol) servers enable.
This comprehensive guide reveals how to transform Claude into your personal market intelligence engine that:
- Analyzes thousands of stocks in seconds
- Identifies high-probability trading setups
- Monitors news sentiment across multiple sources
- Calculates risk-adjusted position sizing
- Validates strategies with historical data
And when you need reliable automated execution, platforms like PickMyTrade complete the picture.
The Trading Decision Problem
Information Overload in Modern Markets
Consider what a professional trader monitors simultaneously:
Technical Analysis:
- Price action across multiple timeframes (1m, 5m, 15m, 1h, 4h, daily)
- 20+ technical indicators (RSI, MACD, Bollinger Bands, Ichimoku, etc.)
- Volume analysis and unusual activity
- Support/resistance levels and chart patterns
- Candlestick patterns and formations
Fundamental Analysis:
- Earnings reports and guidance
- Revenue growth and margin trends
- P/E ratios and valuation metrics
- Analyst recommendations and price targets
- Insider buying/selling activity
Market Context:
- Sector rotation and correlation
- Market breadth indicators
- Economic data releases
- Federal Reserve policy signals
- Geopolitical events and news
Risk Management:
- Position sizing calculations
- Portfolio correlation
- Max drawdown limits
- Stop loss placement
- Risk/reward ratios
Sentiment Analysis:
- News headlines and impact
- Social media trends
- Options flow and put/call ratios
- Institutional ownership changes
- Short interest and squeeze potential
Reality: Processing all this for even 10 stocks is overwhelming. For 100? Impossible for a human alone.
Solution: AI-powered market intelligence via MCP servers.
How AI Transforms Trading Decisions
The MCP-Powered Decision Framework
MCP servers give Claude access to real-time and historical market data, turning it from a general AI assistant into a specialized trading intelligence engine.
Traditional Workflow:
1. Manually check stock screener → 20 minutes
2. Review charts on TradingView → 15 minutes per stock
3. Read news and earnings → 30 minutes
4. Calculate position sizing → 5 minutes
5. Place order in broker platform → 2 minutes
Total: 72+ minutes for ONE trade decision
AI-Powered Workflow:
1. Ask Claude: "Find bullish setups in tech stocks with positive earnings and RSI divergence" → 30 seconds
2. Claude queries MCP servers and returns 5 analyzed opportunities → Analysis that would take hours, delivered instantly
3. Review Claude's recommendations and choose trade → 2 minutes
4. Set TradingView alert or execute via PickMyTrade → 1 minute
Total: 3.5 minutes for MULTIPLE trade decisions
Time savings: 95%
Analysis depth: 10x more comprehensive
Error reduction: Eliminates calculation mistakes
Essential MCP Servers for Trading Decisions
1. Market Data MCP Servers: Your Intelligence Gathering
Yahoo Finance MCP — Quick Data Access
Best for: Real-time price checks, basic fundamentals, watchlist monitoring
Decision Support:
- “What stocks in my watchlist are up more than 2% today?”
- “Show me the P/E ratios for AAPL, MSFT, GOOGL, and AMZN”
- “Alert me if TSLA moves above $250”
Setup: Zero configuration, no API keys
Cost: Free
Speed: Instant
Alpha Vantage MCP — Technical Indicator Engine
Best for: Technical analysis, indicator calculations, multi-asset coverage
Decision Support:
- “Calculate 14-day RSI for all NASDAQ 100 stocks”
- “Show me stocks where 20-MA crossed above 50-MA this week”
- “What’s the MACD reading for SPY on daily and 4-hour charts?”
Setup: Free API key, simple configuration
Cost: Free tier (25 calls/day), paid from $50/mo
Speed: 1-2 seconds per query
Polygon.io MCP — Institutional-Grade Intelligence
Best for: Options analysis, tick-level data, high-frequency patterns
Decision Support:
- “Show unusual options activity for tech stocks today”
- “Detect block trades over 100K shares in the last hour”
- “Get historical volatility for NVDA at 1-minute intervals”
Setup: API key required
Cost: From $29/mo
Speed: Sub-second for real-time data
TradingView MCP — Chart Pattern Recognition
Best for: Multi-timeframe analysis, candlestick patterns, technical setups
Decision Support:
- “Scan for bullish engulfing patterns on daily charts across S&P 500”
- “Find stocks in Bollinger Band squeeze ready for breakout”
- “Analyze AAPL across 1h, 4h, and daily timeframes”
Setup: GitHub installation, minimal config
Cost: Free (uses TradingView’s free data)
Speed: 2-5 seconds per scan
Finnhub MCP — News & Sentiment Intelligence
Best for: News-driven trading, earnings events, sentiment analysis
Decision Support:
- “What’s the latest news on TSLA and overall sentiment?”
- “Which companies report earnings this week with bullish analyst expectations?”
- “Show insider buying activity in biotech sector”
Setup: Free API key available
Cost: Free tier, paid from $60/mo
Speed: 1-2 seconds
2. Execution MCP Servers: Your Order Management
Alpaca MCP — API-First Brokerage
Best for: Paper trading, programmatic execution, portfolio management
Decision Support:
- “What’s my current portfolio allocation and risk exposure?”
- “Buy 10 shares of SPY with stop loss at 2%”
- “Show me my P&L for this week”
Setup: Free Alpaca account, API keys
Cost: Free (commission-free trading)
Speed: 1-3 seconds for execution
Limitation: Requires API configuration and monitoring
PickMyTrade — Professional Automation
Best for: Reliable execution, multi-broker support, TradingView integration
Decision Support:
- “Execute this TradingView strategy automatically”
- “Manage positions across multiple broker accounts”
- “Scale in/out of positions with precision”
Setup: 5 minutes, zero coding
Cost: Subscription-based with free trial
Speed: Sub-second to 2 seconds
Advantage: Enterprise reliability without programming
Real-World AI Trading Decision Workflows
Scenario 1: Swing Trading Momentum Stocks
Objective: Find stocks with strong momentum, bullish technicals, and positive news
Step 1: Initial Scan
You: "Claude, scan for stocks in the NASDAQ 100 that:
     - Are up more than 5% in the last week
     - Have RSI between 50-70 (strong but not overbought)
     - Show volume 50% above average
     - Have positive news sentiment"
Claude: *Queries Yahoo Finance + Alpha Vantage + Finnhub MCP servers*
Found 7 candidates matching criteria:
1. NVDA (NVIDIA)
   - 7-day gain: +8.2%
   - RSI: 65 (daily)
   - Volume: 1.8x average
   - Sentiment: 85% bullish (earnings beat, AI demand strong)
   - Price: $915
2. AMD (Advanced Micro Devices)
   - 7-day gain: +6.1%
   - RSI: 58 (daily)
   - Volume: 1.6x average
   - Sentiment: 75% bullish (partnership announcement)
   - Price: $178
[Additional stocks listed...]
Recommendation: NVDA and AMD show strongest confluence of factors.
Step 2: Deep Dive Analysis
You: "Analyze NVDA across multiple timeframes and show key levels"
Claude: *Queries TradingView MCP + Alpha Vantage*
NVDA Multi-Timeframe Analysis:
Daily Chart:
- Trend: Strong uptrend, price above all major MAs
- RSI: 65 (bullish momentum, not overbought)
- MACD: Bullish crossover 3 days ago
- Pattern: Breaking out of consolidation
- Support: $890 (previous resistance, now support)
- Resistance: $930 (recent high)
4-Hour Chart:
- Trend: Uptrend intact
- RSI: 68 (slight overbought on shorter timeframe)
- Volume: Increasing on up moves (healthy)
- Pattern: Higher highs, higher lows
1-Hour Chart:
- Trend: Short-term consolidation
- RSI: 55 (neutral)
- Price action: Tight range $910-$920
- Signal: Waiting for breakout above $920
Key Levels:
- Entry: Above $920 (breakout confirmation)
- Stop Loss: $890 (below daily support)
- Target 1: $945 (+2.7%)
- Target 2: $970 (+5.4%)
Risk/Reward: 1:2.5 (excellent)
Step 3: Risk-Calculated Position Sizing
You: "I have a $50,000 account and want to risk 1% on this NVDA trade. Calculate position size with stop at $890."
Claude: *Calculates*
Position Sizing for NVDA Trade:
Account Size: $50,000
Risk Tolerance: 1% = $500 max loss
Entry Price: $920 (breakout level)
Stop Loss: $890
Risk Per Share: $30
Calculation:
Max Loss ($500) ÷ Risk Per Share ($30) = 16.67 shares
→ Round down to 16 shares for safety
Position Details:
- Shares: 16
- Entry: $920
- Total Investment: $14,720 (29.4% of account)
- Stop Loss: $890
- Max Loss: $480 (0.96% of account ✓)
- Target 1: $945 → Gain: $400 (+2.7%)
- Target 2: $970 → Gain: $800 (+5.4%)
Risk/Reward Ratio: 1:2.5 (Target 2)
Position approved within risk parameters. ✓
Step 4: Execution Setup
Option A: Manual Execution via Alpaca MCP
You: "Buy 16 shares of NVDA at $920 limit with stop loss at $890"
Claude: *Submits orders via Alpaca MCP*
Option B: Automated Execution via PickMyTrade (Recommended)
You: *Create TradingView alert*
     Alert: "NVDA crosses above $920"
     → Linked to PickMyTrade
     → Auto-executes 16 shares with bracket order (stop + target)
     → No manual intervention needed
Step 5: Position Monitoring
You: "Monitor my NVDA position and alert me if it hits target or approaches stop"
Claude: *Sets up monitoring*
"I'm tracking your NVDA position. Will alert you when:
- Price reaches $945 (Target 1) - suggest taking 50% profit
- Price reaches $970 (Target 2) - suggest closing remainder
- Price drops to $895 (near stop) - recommend manual review
- RSI goes above 80 (overbought) - potential reversal warning"
[Later that day...]
🎯 ALERT: NVDA reached $945 (Target 1)
Your position: +$400 (+2.7%)
Recommendation: Take 50% profit (8 shares), let 8 shares ride to Target 2 with trailing stop at breakeven.
Result:
- Time invested: 10 minutes (vs. 2+ hours manually)
- Analysis depth: Comprehensive multi-timeframe + sentiment + risk calculation
- Execution: Automated and precise
- Risk management: Strictly enforced
- Emotional discipline: Maintained (pre-defined plan)
Scenario 2: News-Driven Event Trading
Objective: Capitalize on earnings announcements and news catalysts
Pre-Earnings Intelligence
You: "Which major tech companies report earnings this week? Show consensus estimates and historical earnings move averages."
Claude: *Queries Finnhub MCP*
Earnings Calendar - This Week:
1. AAPL - Apple Inc.
   Report Date: Thursday After Market Close
   Consensus EPS: $1.54 (vs $1.29 last year)
   Revenue Est: $89.5B (vs $81.8B last year)
   Analyst Sentiment: 82% Buy/Strong Buy
   Historical Avg Move: ±4.2% (next day)
   Options IV: 35% (moderate)
   Key Factors to Watch:
   - iPhone sales in China
   - Services revenue growth
   - Guidance for next quarter
2. MSFT - Microsoft
   Report Date: Tuesday After Market Close
   Consensus EPS: $2.75 (vs $2.32 last year)
   Revenue Est: $61.1B (vs $52.7B last year)
   Analyst Sentiment: 90% Buy/Strong Buy
   Historical Avg Move: ±3.8%
   Options IV: 32%
   Key Factors to Watch:
   - Azure cloud growth
   - AI product revenue
   - Operating margin expansion
[Additional companies...]
Highest Probability Setup: MSFT
- Strong consensus beat expected
- AI tailwinds
- Historical tendency to gap up on good earnings
- Lower IV than AAPL (better risk/reward for options)
Post-Earnings Analysis (Real-Time)
[Tuesday 4:05 PM - MSFT reports earnings]
You: "MSFT just reported earnings. Analyze the results and immediate market reaction."
Claude: *Queries Finnhub + Yahoo Finance MCP in real-time*
MSFT Earnings Analysis:
Results (Just Released):
✓ EPS: $2.85 (Beat by $0.10, +3.6%)
✓ Revenue: $62.0B (Beat by $0.9B, +1.5%)
✓ Azure Growth: +31% (Ahead of expectations)
✓ AI Revenue: $10B annualized (Strong)
✓ Guidance: Raised for next quarter
Immediate Market Reaction:
- After-hours price: $432 → $441 (+2.1% in 5 minutes)
- Volume surge: 8x average after-hours volume
- Options activity: Calls heavily bid
News Sentiment Analysis:
- Bloomberg: "Microsoft beats on AI strength" (Bullish)
- CNBC: "Azure growth accelerates" (Bullish)
- WSJ: "AI monetization ahead of schedule" (Very Bullish)
- Sentiment Score: 92% Bullish
Technical Context:
- Pre-earnings close: $432
- After-hours high: $442
- Key resistance: $445 (previous all-time high)
- If breaks $445, next target: $460
Trading Recommendation:
Given strong beat + raised guidance + bullish sentiment:
- High probability gap up tomorrow (estimate: +3-4%)
- Consider long position at market open if momentum continues
- Watch $445 resistance - breakout could extend to $460
- Alternative: Wait for pullback to $438-440 for better entry
Risk: Any hint of weak guidance in conference call (5:30 PM) could reverse gains.
Monitor call for confirmation.
Live Conference Call Monitoring
[During earnings call - 5:30 PM]
Claude: *Monitors news feeds via Finnhub MCP*
Earnings Call Key Points:
5:35 PM - CEO highlights AI product adoption exceeding expectations
→ Stock ticks up to $443
5:42 PM - CFO confirms margin expansion continuing
→ Stock holds $443
5:50 PM - Q&A: Analyst asks about cloud competition
→ CEO confident in Azure differentiation
→ Stock pushes to $445 (resistance test)
6:05 PM - Call ends
→ Final after-hours price: $446 (+3.2%)
→ Resistance broken ✓
Overnight Recommendation:
Strong likelihood of gap up at open tomorrow.
Consider:
1. Buy at market open if gap sustains above $445
2. Stop loss if breaks below $442 (gap fill)
3. Target: $460 (+3% from projected open)
Next Day Execution
[Wednesday 9:30 AM - Market Open]
You: "What's MSFT opening at and should I enter?"
Claude: *Checks Yahoo Finance MCP*
MSFT Market Open Analysis:
Opening Price: $447 (gapped up +3.5% as expected)
Opening Volume: 12M shares in first minute (very strong)
Price Action: Holding above $445 support ✓
Momentum: Buyers in control
Entry Decision: YES
- Gap held (no immediate rejection)
- Volume confirms institutional participation
- Cleared resistance ($445) now acting as support
Recommended Entry: $447
Stop Loss: $442 (below gap fill level)
Target: $460
Risk: $5/share | Reward: $13/share
Risk/Reward: 1:2.6 ✓
[You set TradingView alert or use PickMyTrade to execute]
Position: Long 50 shares MSFT @ $447
Stop: $442
Target: $460
Risk: $250
Potential Gain: $650
Result:
- AI-powered edge: Instant earnings analysis vs. spending 30 minutes reading reports
- Sentiment tracking: Real-time news aggregation across multiple sources
- Technical confirmation: Multi-factor validation before entry
- Disciplined execution: Pre-calculated risk parameters
Scenario 3: Multi-Stock Portfolio Rebalancing
Objective: Optimize portfolio allocation based on current market conditions
Portfolio Health Check
You: "Analyze my current portfolio and suggest rebalancing based on sector exposure, correlation, and momentum."
Claude: *Queries Alpaca MCP for positions + Alpha Vantage for analytics*
Current Portfolio Analysis ($100,000 total):
Holdings:
1. AAPL - 100 shares @ $178 = $17,800 (17.8%)
2. MSFT - 50 shares @ $447 = $22,350 (22.4%)
3. GOOGL - 80 shares @ $141 = $11,280 (11.3%)
4. AMZN - 50 shares @ $175 = $8,750 (8.8%)
5. NVDA - 20 shares @ $915 = $18,300 (18.3%)
6. TSLA - 30 shares @ $242 = $7,260 (7.3%)
7. Cash = $14,260 (14.3%)
Sector Breakdown:
- Technology: 76% (AAPL, MSFT, GOOGL, NVDA)
- Consumer Discretionary: 16% (AMZN, TSLA)
- Cash: 14%
Correlation Analysis:
- AAPL/MSFT: 0.82 (high - similar moves)
- AAPL/GOOGL: 0.78 (high)
- MSFT/GOOGL: 0.85 (very high)
- NVDA/TSLA: 0.65 (moderate)
- Portfolio is highly correlated - lacks diversification
Momentum Score (20-day):
✓ MSFT: +8.2% (Strong)
✓ NVDA: +7.5% (Strong)
✓ AAPL: +4.1% (Moderate)
✓ GOOGL: +2.8% (Moderate)
✓ AMZN: +1.2% (Weak)
⚠ TSLA: -3.5% (Negative momentum)
Issues Identified:
1. Over-concentration in Tech (76%)
2. High correlation = portfolio moves as one unit
3. TSLA showing weakness
4. Cash allocation appropriate but could be deployed
Rebalancing Recommendations:
Action 1: Reduce TSLA (weak momentum, negative divergence)
→ Sell 30 shares TSLA @ $242 = $7,260
Action 2: Take partial profits on NVDA (extended, reduce concentration)
→ Sell 5 shares NVDA @ $915 = $4,575
Action 3: Rotate into defensive sector (reduce correlation)
→ Buy Healthcare ETF (XLV) $6,000
→ Buy Consumer Staples ETF (XLP) $5,000
Action 4: Add emerging tech diversification
→ Buy PLTR (AI/Data) $3,500
→ Buy CRWD (Cybersecurity) $3,335
New Portfolio Allocation:
- Big Tech: 58% (reduced from 76%)
- Healthcare: 6%
- Consumer Staples: 5%
- Emerging Tech: 7%
- Cash: 24% (war chest for opportunities)
Expected Impact:
- Reduced correlation: Portfolio beta decreases
- Better risk/reward: Diversified sector exposure
- Maintain growth: Still 65% in growth stocks
- Defensive buffer: 11% in defensive sectors
Execution:
Option A: Manual via Alpaca MCP
You: "Execute the rebalancing plan"
Claude: *Submits all orders sequentially*
Option B: Automated via PickMyTrade
Create TradingView alerts for each trade
PickMyTrade executes entire rebalancing automatically
Complete portfolio transition in minutes
Scenario 4: Risk Management & Stop Loss Optimization
Objective: Dynamically adjust stop losses based on volatility and support levels
Volatility-Adjusted Stops
You: "I'm holding NVDA at $900 entry. Calculate optimal stop loss based on current volatility."
Claude: *Queries Alpha Vantage + TradingView MCP*
NVDA Stop Loss Analysis:
Current Position:
- Entry: $900
- Current Price: $935 (+3.9%)
- Shares: 20
- Unrealized Gain: $700
Volatility Metrics:
- ATR (14-day): $28.50 (Average True Range)
- Historical Volatility (30-day): 42%
- Recent Daily Range: $20-35
Support Levels (Technical):
- Strong Support: $915 (previous resistance, high volume)
- Moderate Support: $905 (20-day moving average)
- Weak Support: $895 (minor pivot)
Stop Loss Options:
1. Tight Stop (Breakeven Protection)
   Level: $905
   Distance: -$30 (-3.2%)
   Pros: Protects most of your gain
   Cons: Could get stopped on normal volatility (1 ATR = $28.50)
   Risk: Likely to get hit on routine pullback
2. Volatility-Based Stop (Recommended)
   Level: $895 (2x ATR below current = $935 - $57 ≈ $878, but support at $895)
   Distance: -$40 (-4.3%)
   Pros: Accounts for normal volatility, strong support confluence
   Cons: Gives back more profit if hit
   Risk: Better balance - unlikely to get hit on noise
3. Trailing Stop (Dynamic)
   Initial: $895
   Trail: 5% (updates as price rises)
   Current Trail Level: $888 ($935 - 5%)
   Pros: Locks in increasing profits as stock rises
   Cons: Can get whipsawed in volatile conditions
4. Time-Based Stop (Earnings Consideration)
   NVDA reports earnings in 12 days
   Recommendation: Tighten stop to $915 two days before earnings
   Rationale: Lock in gains, avoid earnings volatility
Recommended Strategy:
- Use volatility-based stop at $895 now
- If NVDA rises above $950, raise stop to $920 (2%)
- Switch to trailing 4% stop above $1000
- Tighten to $915 before earnings announcement
This protects your position while giving the trade room to work.
Monitoring & Alerts:
You: "Monitor NVDA and alert me if any stop conditions are triggered or if I should adjust stops"
Claude: *Sets up intelligent monitoring*
Active NVDA Monitoring:
Current Alerts Set:
🔔 Price drops to $895 → STOP LOSS ALERT
🔔 Price rises above $950 → RAISE STOP RECOMMENDATION
🔔 RSI goes above 75 → OVERBOUGHT WARNING
🔔 Volume spike > 2x average → UNUSUAL ACTIVITY
🔔 Negative news detected → SENTIMENT SHIFT ALERT
🔔 10 days to earnings → TIGHTEN STOP REMINDER
[Next day...]
🚨 ALERT: NVDA hit $952 (above $950)
Recommendation: Raise stop loss to $920 per our plan
This locks in $20/share profit ($400 total) while staying in the trend.
[You update stop via broker or PickMyTrade adjusts automatically]
Advanced AI Trading Decision Techniques
1. Multi-Source Signal Confirmation
Never rely on a single indicator or data source. Use AI to aggregate multiple signals:
You: "Confirm bullish thesis for AAPL using at least 3 different data sources and analysis methods"
Claude: *Queries Yahoo Finance + Alpha Vantage + TradingView + Finnhub*
AAPL Multi-Source Confirmation Analysis:
Source 1: Technical Analysis (TradingView MCP)
✓ RSI: 62 (bullish momentum)
✓ MACD: Bullish crossover 2 days ago
✓ Price: Above 20, 50, 200-day MAs
✓ Pattern: Cup and handle formation completing
✓ Signal: BULLISH
Source 2: Fundamental Data (Alpha Vantage)
✓ P/E Ratio: 28.5 (in-line with historical average)
✓ EPS Growth: +12% YoY
✓ Revenue Growth: +8% YoY
✓ Profit Margin: Expanding (improving efficiency)
✓ Signal: BULLISH
Source 3: News Sentiment (Finnhub)
✓ Recent Headlines: 85% positive
✓ Analyst Upgrades: 3 upgrades, 0 downgrades this month
✓ Price Target Consensus: $195 (9% upside)
✓ Insider Activity: 2 insider buys, 0 sells
✓ Signal: BULLISH
Source 4: Market Data (Yahoo Finance)
✓ Relative Strength vs SPY: Outperforming by 3.2%
✓ Volume Trend: Increasing on up days (accumulation)
✓ Options Flow: Call volume > Put volume (1.8:1 ratio)
✓ Sector Performance: Tech sector leading market
✓ Signal: BULLISH
Confirmation Score: 4/4 sources BULLISH ✓✓✓✓
Confidence Level: HIGH
All four independent analysis methods agree on bullish bias.
This is a high-conviction setup with multiple layers of confirmation.
Recommended Action: Enter long position with defined risk.
2. Scenario Analysis & “What-If” Modeling
Use AI to model different market scenarios:
You: "Model three scenarios for my SPY position over the next 2 weeks: bullish, base case, and bearish. Include probabilities."
Claude: *Analyzes historical patterns + current conditions*
SPY Position Scenario Analysis:
Current: SPY @ $525, holding 50 shares, cost basis $520
Scenario 1: BULLISH (30% probability)
Drivers:
- Fed signals rate cuts
- Earnings season beats expectations
- Economic data remains strong
Price Target: $545 (+3.8%)
Your P&L: +$1,000 (+3.8% on position)
Exit Strategy: Take profits at $540-545, trail stop
Scenario 2: BASE CASE (50% probability)
Drivers:
- Fed maintains cautious stance
- Mixed earnings results
- Economic data shows mild slowdown
Price Target: $530 (+0.95%)
Your P&L: +$250 (+0.95% on position)
Exit Strategy: Hold with $520 stop, wait for breakout
Scenario 3: BEARISH (20% probability)
Drivers:
- Fed disappoints (no rate cut signal)
- Major tech company misses earnings
- Unexpected geopolitical event
Price Target: $505 (-3.8%)
Your P&L: -$1,000 (-3.8% on position)
Exit Strategy: Stop loss at $515 limits loss to $250
Expected Value Calculation:
= (0.30 × $1,000) + (0.50 × $250) + (0.20 × -$250)
= $300 + $125 - $50
= +$375 expected value
Risk/Reward: Favorable
With 30% stop loss at $515, your max loss is $250
Potential gains in bullish scenario: $1,000
Expected value: Positive
Recommendation: HOLD position with $515 stop loss.
Risk is defined and expected value is positive.
3. Automated Strategy Backtesting
Validate trading ideas with historical data:
You: "Backtest a simple strategy: Buy SPY when RSI crosses above 30, sell when RSI crosses above 70. Test last 2 years."
Claude: *Queries Alpha Vantage for historical data*
SPY RSI Mean Reversion Strategy Backtest:
Test Period: Jan 2023 - Jan 2025 (2 years)
Strategy: Long only, RSI (14-day) crossover signals
Capital: $10,000 starting
Results Summary:
Total Trades: 24
Winning Trades: 16 (66.7%)
Losing Trades: 8 (33.3%)
Performance Metrics:
Total Return: +18.2% ($11,820 final)
Buy & Hold Return: +15.3% ($11,530 final)
Excess Return: +2.9% (strategy outperformed)
Average Win: +4.8%
Average Loss: -2.1%
Win/Loss Ratio: 2.29:1
Largest Win: +12.3%
Largest Loss: -4.8%
Risk Metrics:
Max Drawdown: -8.2%
Sharpe Ratio: 1.42 (good risk-adjusted return)
Win Rate: 66.7%
Best Performing Conditions:
✓ Strategy works best in ranging markets
✓ Outperforms during volatility spikes
✓ Underperforms in strong trends (whipsaws)
Months with Best Performance:
- Oct 2023: +8.2% (market volatility)
- Mar 2024: +6.1% (market volatility)
- Aug 2024: +5.8% (correction bounce)
Months with Worst Performance:
- Nov 2023: -3.2% (strong uptrend, false signals)
- Apr 2024: -2.8% (choppy conditions)
Conclusion:
Strategy shows positive edge with acceptable risk.
Best used as complement to other strategies.
Consider filtering trades with trend confirmation (e.g., price above 200-MA).
Optimization Suggestion:
Add filter: Only take long signals when SPY > 200-day MA
Expected improvement: Win rate → 75%, reduces whipsaws
4. Real-Time News Impact Analysis
React to breaking news with speed:
[Breaking news alert]
You: "Claude, JPMorgan just issued a major market warning. Analyze impact on my portfolio immediately."
Claude: *Queries Finnhub + Yahoo Finance in real-time*
BREAKING NEWS IMPACT ANALYSIS:
News: "JPMorgan warns of 25% market correction risk in Q2"
Source: Bloomberg, CNBC, Reuters (confirmed by multiple sources)
Time: 10:42 AM EST
Market Reaction: SPY down -1.2% in 10 minutes
Your Portfolio Exposure:
Current Holdings @ Risk:
1. NVDA (20 shares @ $935) = $18,700
   Immediate impact: -2.1% (-$393)
   High beta → more volatile in corrections
2. TSLA (30 shares @ $242) = $7,260
   Immediate impact: -3.5% (-$254)
   Very high beta → extremely sensitive
3. MSFT (50 shares @ $447) = $22,350
   Immediate impact: -1.5% (-$335)
   Moderate beta → defensive tech
4. Defensive positions:
   XLV Healthcare ETF: -0.3% (holding well ✓)
   XLP Consumer Staples: +0.2% (rising - flight to safety ✓)
Total Portfolio Impact: -$982 (-1.4%)
Sentiment Shift:
- Fear Index (VIX): +18% (spike to 22)
- Put/Call Ratio: Jumped from 0.8 to 1.3 (bearish)
- Treasury yields: Dropping (safety bid)
Immediate Recommendations:
URGENT (Next 15 minutes):
1. Tighten stops on high-beta names:
   - NVDA: Raise stop to $920 (was $895)
   - TSLA: Set stop at $238 (protect capital)
2. Consider taking profits on extended positions:
   - MSFT up 8% from entry → take 50% off at current levels
3. Increase cash allocation:
   - Sell TSLA entirely if you're risk-averse
   - Raises cash to 30% from 24%
4. Add hedges if you want to keep positions:
   - Buy SPY puts (1-month out, 5-10% OTM)
   - Cost ~1% of portfolio for insurance
SHORT-TERM (Today):
Monitor Fed officials' responses to JPM warning
Watch for support levels:
- SPY support at $518 (critical)
- If breaks $518, could accelerate to $505
Do NOT panic sell quality positions (MSFT, AAPL) unless technical support breaks.
Your current defensive allocation (Healthcare, Staples) is working as intended - they're your protection.
Combining AI Analysis with Reliable Execution
The Analysis-Execution Gap
The Problem:
MCP servers give incredible analytical power, but execution requires:
- API configuration and maintenance
- Error handling and monitoring
- Order management logic
- Multi-broker coordination
- 24/7 reliability
The Solution:
Combine AI analysis (MCP servers + Claude) with professional execution (PickMyTrade)
The Optimal Hybrid Workflow
Phase 1: AI-Powered Research (Morning)
7:00 AM - Pre-market analysis
You: "Claude, what are today's market-moving catalysts and high-probability setups?"
→ Claude scans news (Finnhub), technicals (TradingView), data (Alpha Vantage)
→ Identifies 3-5 actionable opportunities
→ Provides context, levels, and risk parameters
Phase 2: Strategy Development (Pre-Market)
8:30 AM - Refine strategy
You: "For each setup, calculate position sizing and define entry/stop/target levels"
→ Claude provides exact parameters for each trade
→ You review and approve strategies
→ Takes 10 minutes vs. 2 hours manually
Phase 3: Alert Creation (TradingView)
9:00 AM - Set up automation
For each approved strategy:
→ Create TradingView alert with exact entry conditions
→ Link alert to PickMyTrade
→ Configure position size, stops, targets
→ 5 minutes per strategy = 25 minutes total for 5 setups
Phase 4: Automated Execution (Market Hours)
9:30 AM - 4:00 PM - Hands-free trading
→ Alerts trigger automatically when conditions met
→ PickMyTrade executes with precision
→ Orders include bracket stops and targets
→ You monitor via phone notifications
→ No emotional decision-making
→ No missed entries due to distraction
Phase 5: AI-Powered Monitoring (Ongoing)
Throughout the day:
You: "Claude, update me on active positions"
→ Claude queries Alpaca MCP or data sources
→ Alerts you to important price levels
→ Suggests adjustments (trail stops, take profits)
→ Identifies new opportunities as they develop
Phase 6: Performance Review (After Hours)
4:30 PM - Daily review
You: "Claude, analyze today's trades and identify what worked"
→ Claude reviews win/loss patterns
→ Suggests strategy improvements
→ Updates watchlist for tomorrow
→ Continuous improvement feedback loop
Why This Hybrid Approach Wins
AI Analysis (MCP Servers) Provides:
✓ Comprehensive market scanning
✓ Multi-source data aggregation
✓ Complex calculations in seconds
✓ Pattern recognition at scale
✓ Emotion-free analysis
Professional Execution (PickMyTrade) Provides:
✓ Reliability (99.9% uptime)
✓ Speed (sub-second execution)
✓ Multi-broker support
✓ Zero coding required
✓ Enterprise-grade infrastructure
✓ Error handling and notifications
✓ Trade audit trails
Combined Result:
✓ Institutional-quality analysis (normally $10K+/mo)
✓ Professional execution (normally requires dev team)
✓ Time savings: 90%+ vs. manual trading
✓ Error reduction: Near-zero calculation mistakes
✓ Emotional discipline: Pre-defined plans executed automatically
✓ Scalability: Manage 10+ strategies simultaneously
Start Your Free PickMyTrade Trial →
Building Your AI Trading Decision System
Week 1: Foundation Setup
Day 1-2: Install Core MCP Servers
- Yahoo Finance MCP (free, no API key)
- Alpha Vantage MCP (free tier for testing)
- Test queries: “Get AAPL price”, “Calculate RSI for SPY”
Day 3-4: Add Execution Capability
- Alpaca paper trading account + MCP server
- Test: “Buy 1 share of SPY”, “Show my positions”
Day 5: Develop Your First Strategy
- Use Claude to analyze a simple setup (e.g., RSI oversold bounce)
- Backtest the strategy with historical data
- Define exact entry/exit rules
Day 6-7: Practice Decision-Making
- Run through 10 practice scenarios with Claude
- Ask: “Should I buy this setup?” for various conditions
- Learn to interpret AI recommendations critically
Week 2: Advanced Capabilities
Day 8-9: Add News Intelligence
- Install Finnhub MCP
- Practice: “What’s the sentiment on TSLA?”
- Learn to combine technical + fundamental + sentiment
Day 10-11: Multi-Stock Analysis
- Practice portfolio-level queries
- “Analyze correlation across my holdings”
- “Rebalance my portfolio for optimal risk/reward”
Day 12-13: Risk Management Mastery
- Learn position sizing calculations
- Practice: “Calculate risk for this trade”
- Develop stop loss optimization skills
Day 14: Live Paper Trading
- Execute 3-5 trades in paper account using AI analysis
- Track performance meticulously
- Refine your decision-making process
Week 3: Automation & Scale
Day 15-16: TradingView Integration
- Set up TradingView charts
- Create alerts based on AI-identified setups
- Learn alert syntax and conditions
Day 17-18: PickMyTrade Setup (Optional but Recommended)
- Connect broker to PickMyTrade
- Link TradingView alerts to execution
- Test with paper trading or micro positions
Day 19-20: Workflow Optimization
- Develop morning routine template
- Create saved prompts for common queries
- Build watchlist monitoring system
Day 21: Full System Test
- Run complete workflow: Research → Analysis → Alerts → Execution → Monitoring
- Identify bottlenecks and optimize
- Prepare for live trading
Week 4: Live Trading (Cautiously)
Day 22-24: Small Position Live Trading
- Start with 10-25% of normal position size
- Use all AI decision support
- Focus on process over profits
Day 25-27: Gradually Increase Size
- If first trades go well, increase to 50% position size
- Continue strict risk management
- Document every decision
Day 28: Weekly Review & Adjustment
- Analyze first week of live trading
- Use Claude: “Review my trades and find improvement areas”
- Adjust strategies based on learnings
- Plan for Month 2
Common Pitfalls & How to Avoid Them
Pitfall 1: Over-Reliance on AI
Problem: Treating AI recommendations as guaranteed winners
Solution:
- AI is a copilot, not autopilot
- Always understand the reasoning behind recommendations
- Maintain final decision authority
- Use AI to enhance, not replace, your judgment
Pitfall 2: Ignoring Risk Management
Problem: Focusing on entries while neglecting position sizing and stops
Solution:
- Always ask Claude to calculate position size first
- Never enter without defined stop loss
- Use: “Calculate risk-adjusted position for [trade]”
- Stick to 1-2% risk per trade rule
Pitfall 3: Analysis Paralysis
Problem: Endless research without execution
Solution:
- Set time limits: 15 minutes max per decision
- Trust multi-source confirmation (3+ bullish signals = go)
- Use checklists: “If A + B + C = true, execute”
- Remember: Doing nothing is also a decision (and often costly)
Pitfall 4: Ignoring Market Context
Problem: Taking technical signals without considering broader market conditions
Solution:
- Always check: “What’s the overall market trend?”
- Avoid long setups in bear markets (and vice versa)
- Use: “Analyze sector rotation and current market regime”
- Respect the tape: Don’t fight the Fed or major trends
Pitfall 5: Poor Data Quality
Problem: Using delayed or inaccurate data for time-sensitive decisions
Solution:
- Verify data sources: Check timestamps
- Upgrade to real-time feeds for active trading ($29-99/mo)
- Cross-reference: “Confirm this data with another source”
- Understand API rate limits and delays
Pitfall 6: Neglecting Execution Quality
Problem: Great analysis but poor execution (slippage, missed fills, errors)
Solution:
- Use professional execution infrastructure (PickMyTrade)
- Monitor fill quality: “Did I get price I expected?”
- Set realistic limit orders (don’t penny-pinch)
- Automate to eliminate emotional hesitation
Measuring Your AI Trading Decision Success
Key Performance Indicators
1. Decision Quality Metrics
- Win rate: % of profitable trades
- Average win vs. average loss
- Risk/reward ratio achieved
- Time from analysis to execution
2. Process Metrics
- AI recommendation accuracy
- Multi-source confirmation success rate
- Backtest vs. live performance alignment
- Number of missed opportunities (should decrease)
3. Efficiency Metrics
- Time spent per trading decision (should decrease 80%+)
- Number of stocks analyzed per hour (should increase 10x)
- Emotional decision rate (should approach 0%)
4. Risk Management Metrics
- Max drawdown
- Average risk per trade
- Portfolio correlation
- Stop loss adherence rate
Monthly Review Template
Ask Claude:
"Analyze my last month of trading:
- Overall P&L and win rate
- Best and worst performing strategies
- Common characteristics of winning vs losing trades
- Risk management adherence
- Suggested improvements for next month"
Conclusion: The AI-Augmented Trading Edge
The integration of MCP servers with Claude represents a paradigm shift in retail trading. For the first time, individual traders have access to analytical capabilities that rival institutional trading desks capabilities that previously required teams of analysts and millions in infrastructure.
The transformation is clear:
| Aspect | Before AI Decision Support | With AI Decision Support |
|---|---|---|
| Manual data gathering | Hours | Seconds |
| Limited stocks analyzed | 5-10 per day | Hundreds per day |
| Calculation errors | Common | Near-perfect |
| Emotional decisions | Frequent | Enforced by process |
| Missed opportunities | Many | Rare (alerts catch everything) |
| Consistency | Difficult to maintain | Systematic approach |
The numbers speak:
- 95% time savings on analysis
- 10x more opportunities identified daily
- 2-3x improvement in decision quality (via multi-source confirmation)
- Near-zero calculation errors (AI doesn’t make math mistakes)
- Elimination of emotional trading (pre-defined plans + automation)
But remember: Tools don’t make traders successful. Discipline, risk management, and continuous learning do. AI amplifies your capabilities—both good and bad habits. Use it to reinforce best practices, not shortcuts.
Your Next Steps:
- This week: Set up your first MCP servers (Yahoo Finance + Alpha Vantage)
- This month: Develop your AI-assisted analysis workflow in paper trading
- Next month: Add automation with PickMyTrade for professional execution
- This quarter: Refine and scale your edge
The future belongs to traders who effectively combine:
- AI-powered analysis for superior decision-making
- Systematic processes for consistency
- Professional execution for reliability
- Human judgment for final accountability
You now have the knowledge. The question is: Will you act on it?
Ready to transform your trading decisions?
For AI Analysis: Start with the MCP server guides in this article
For Professional Execution: Try PickMyTrade free for 14 days →
The edge is available. Will you take it?
Resources & Further Learning
MCP Server Setup Guides
- Yahoo Finance MCP – Free, zero config
- Alpha Vantage MCP – Technical indicators
- Alpaca Official MCP – Brokerage integration
- TradingView MCP – Chart analysis
- Finnhub MCP – News & sentiment
Trading Automation
- PickMyTrade – Multi-broker automation platform
- TradingView – Charting and alert system
- Alpaca Markets – Commission-free API trading
Educational Resources
- MCP Documentation – Official protocol docs
- Alpaca Learn – Algo trading education
- TradingView Education – Technical analysis
Community & Support
- PickMyTrade Documentation – Setup guides
- Alpaca Community – API trading discussions
- TradingView Community – Strategy sharing
Disclaimer: This content is for educational purposes only and does not constitute financial advice. Trading involves significant risk of loss. Past performance does not guarantee future results. Always use paper trading to test strategies before risking real capital. MCP servers and AI assistants are decision support tools, not guaranteed profit systems. The author and PickMyTrade are not responsible for trading losses.
Transform your trading with AI-powered decisions and professional execution. Start free trial →
This guide has been meticulously structured to serve as a standalone blog post, optimized for readability with Markdown formatting, tables for comparisons, and embedded code blocks for workflows. It preserves all original details while enhancing flow and visual appeal for an engaging reader experience. If you’d like customizations, such as adding images or SEO keywords, let me know!
You may also like:
Best Automated Trading Bots 2025: PickMyTrade vs Competition
Technical Indicators for Algorithmic Trading on PickMyTrade: The Complete Guide for 2025
Alpaca vs Polygon.io vs Traditional Brokers: The Ultimate MCP Integration Guide for USA Stock Traders
How to Connect Interactive Brokers API with Claude AI Using MCP Servers