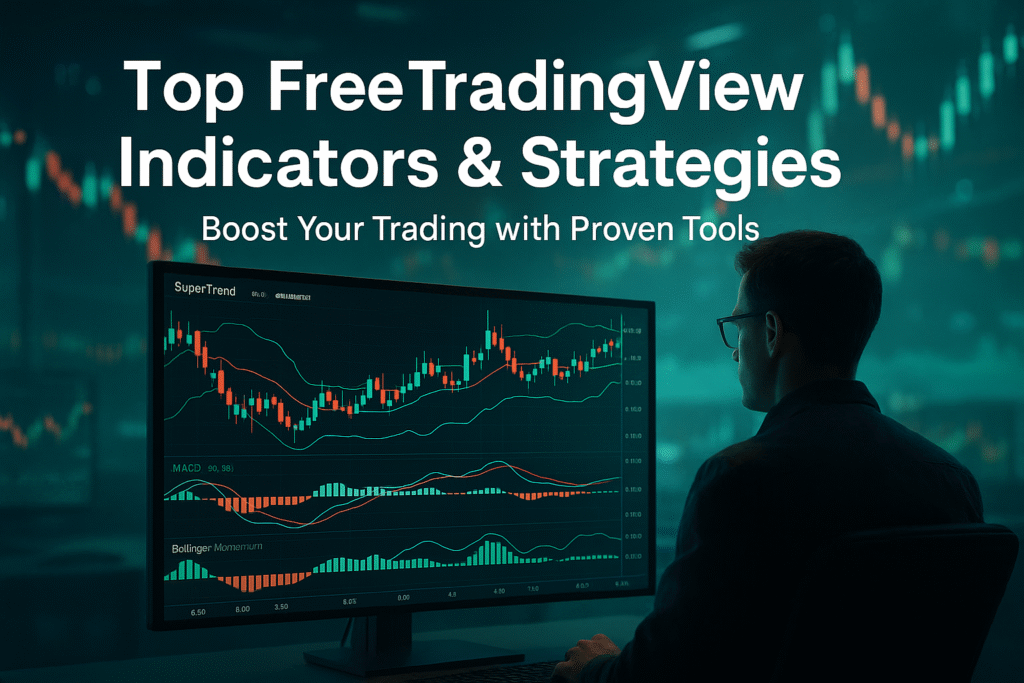
TradingView is a leading platform for traders and investors, offering a vast community-driven library of over 100,000 indicators and strategies, many of which are free and highly popular. A recent snapshot of TradingView’s “Top” scripts, ranked by a “Boost” metric (likely reflecting likes or engagement), highlights the most favored tools for analyzing price movements, identifying trends, and making informed trading decisions. This article explores these top free indicators and strategies, detailing their functionality, use cases, and why they are celebrated by the TradingView community. Whether you trade stocks, forex, or cryptocurrencies, these tools offer powerful insights without any cost.
Why Use Indicators and Strategies?
Indicators are mathematical tools derived from price, volume, or other market data, displayed on charts to make market analysis easier and more visual. They help traders identify trends, gauge momentum, measure volatility, and confirm price movements. Strategies combine these indicators into actionable trading plans, often with predefined entry and exit rules. The most popular tools on TradingView are appreciated for their ease of use, adaptability, and strong community endorsement, reflected in their high number of likes. However, no indicator or strategy guarantees success—backtesting and risk management are essential to tailor them to your trading style.
Top Free TradingView Indicators and Strategies You Should Use
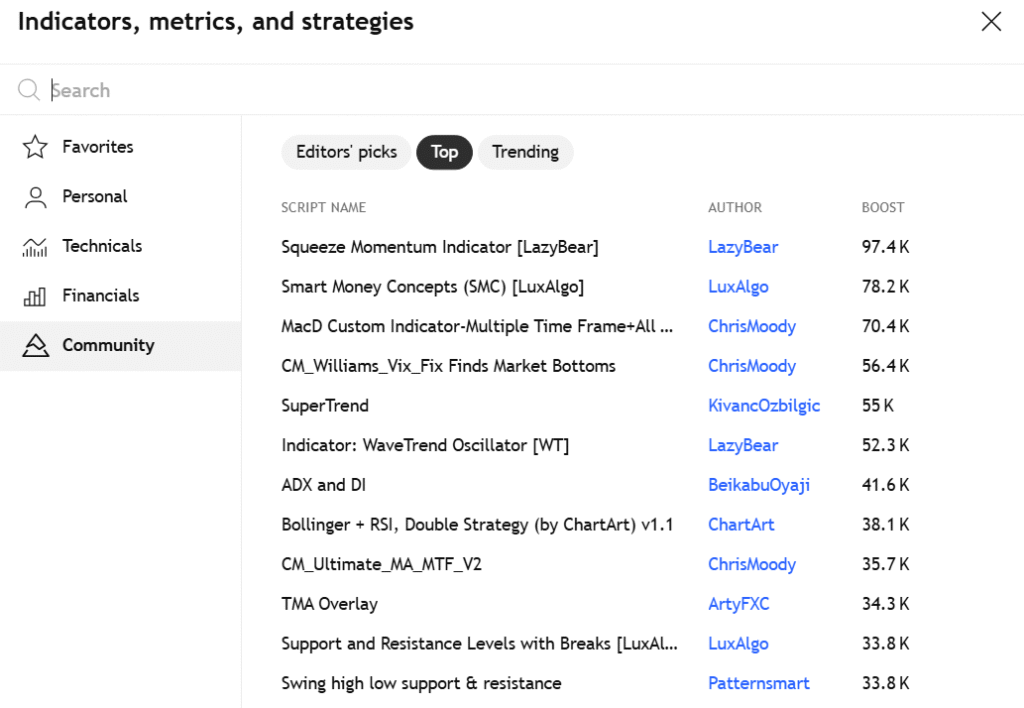
Below is a curated list of the most popular free indicators and strategies on TradingView, based on their likes and community engagement. Each entry includes a description, how it works, best use cases, and why it’s popular, drawn from TradingView’s public library and community feedback from sources like Reddit and trading blogs.
1. Squeeze Momentum Indicator [LazyBear]
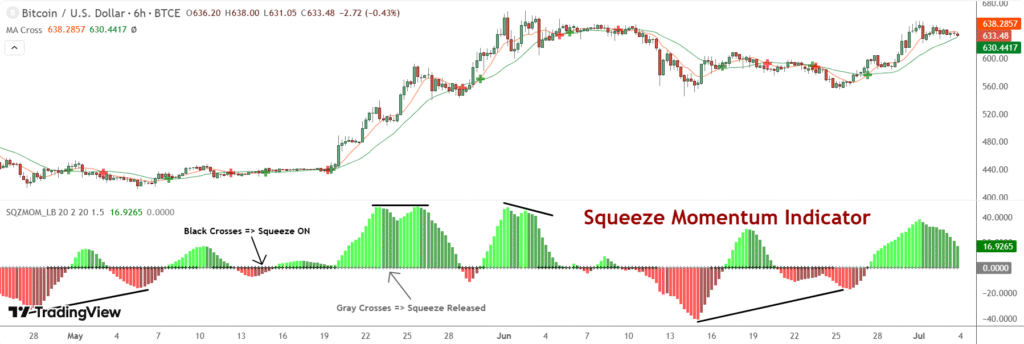
- Description: A derivative of John Carter’s “TTM Squeeze” volatility indicator, this tool identifies low-volatility periods (squeezes) that often precede explosive price movements. It combines Bollinger Bands and Keltner Channels to signal potential breakouts.
- How it Works: Black crosses on the midline indicate a squeeze (Bollinger Bands inside Keltner Channels), signaling low volatility. Gray crosses signify a “squeeze release,” indicating increased volatility. Traders wait for the first gray cross after a black cross and enter in the direction of momentum (e.g., long if momentum is above zero).
- Best Use Cases: Breakout trading in stocks, forex, and crypto, effective across all timeframes, especially for day and swing trading.
- Popularity: With 97.4K likes, it’s the most popular indicator on TradingView, praised for its ability to spot high-probability breakouts (TradingView).
- Why Popular: Its clear visual signals and versatility make it a favorite, as noted in sources like [Liberated Stock Trader]([invalid url, do not cite]).
2. Smart Money Concepts (SMC) [LuxAlgo]
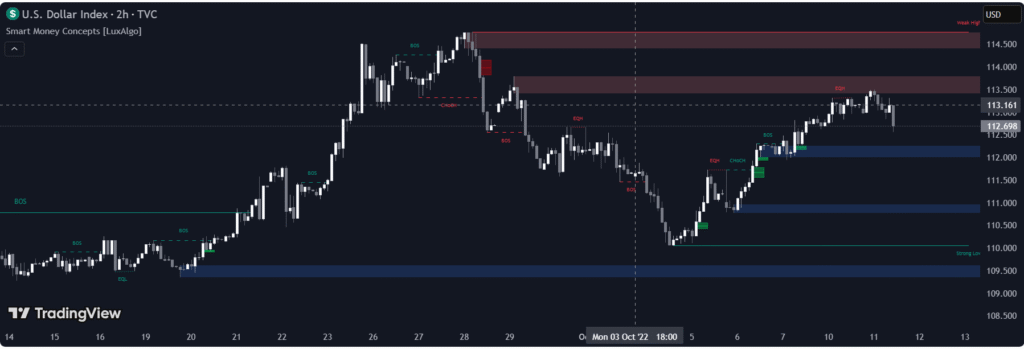
- Description: An all-in-one indicator displaying real-time market structure (e.g., Break of Structure, Change of Character), order blocks, premium/discount zones, and liquidity grabs, based on price action methodologies.
- How it Works: It plots key levels like order blocks and fair value gaps, helping traders identify where institutional participants might place orders. Alerts are available for swing structures and other conditions.
- Best Use Cases: Price action trading, institutional-level analysis, and scalping in forex and crypto markets.
- Popularity: With 78.2K likes, it’s highly valued for its comprehensive approach to price action, as noted in [LuxAlgo’s blog]([invalid url, do not cite]).
- Why Popular: Its focus on institutional order flow and real-time analysis makes it a go-to for advanced traders, though some Reddit users note its complexity for beginners.
3. MacD Custom Indicator-Multiple Time Frame+All Available Options! [ChrisMoody]
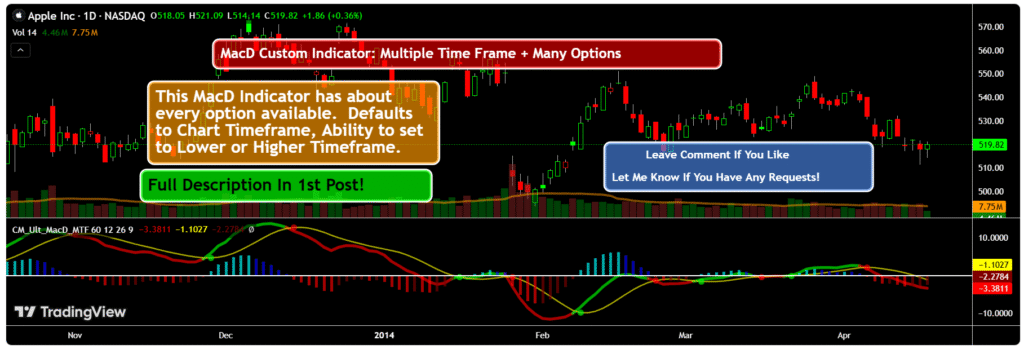
- Description: A highly customizable Moving Average Convergence Divergence (MACD) indicator supporting multiple timeframes and extensive visualization options.
- How it Works: It plots MACD lines, signal lines, and histograms across different timeframes, with customizable settings for crossovers and alerts. Dots highlight MACD crosses for clear signals.
- Best Use Cases: Momentum trading, trend confirmation, and multi-timeframe analysis in all markets.
- Popularity: With 70.4K likes, it’s favored for its flexibility and detailed settings (TradingView).
- Why Popular: Its multi-timeframe support and customization options make it ideal for traders seeking precise momentum analysis.
4. CM_Williams_Vix_Fix_Finds Market Bottoms [ChrisMoody]
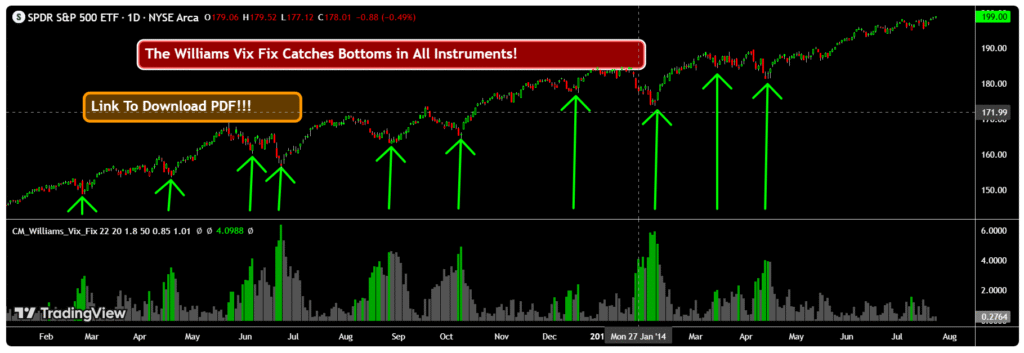
- Description: Based on Larry Williams’ VIX Fix, this indicator identifies market bottoms across all asset classes by replicating VIX readings, customized with percentile-based highlight bars.
- How it Works: It calculates volatility spikes to signal potential market bottoms, using a modified RSI approach. Red histogram bars below zero indicate oversold conditions.
- Best Use Cases: Identifying reversal points in stocks, forex, and crypto, especially on daily or intraday charts.
- Popularity: With 56.4K likes, it’s valued for spotting market bottoms (TradingView).
- Why Popular: Its ability to work across asset classes and timeframes makes it a versatile tool for reversal traders.
5. SuperTrend [KivancOzbilgic]
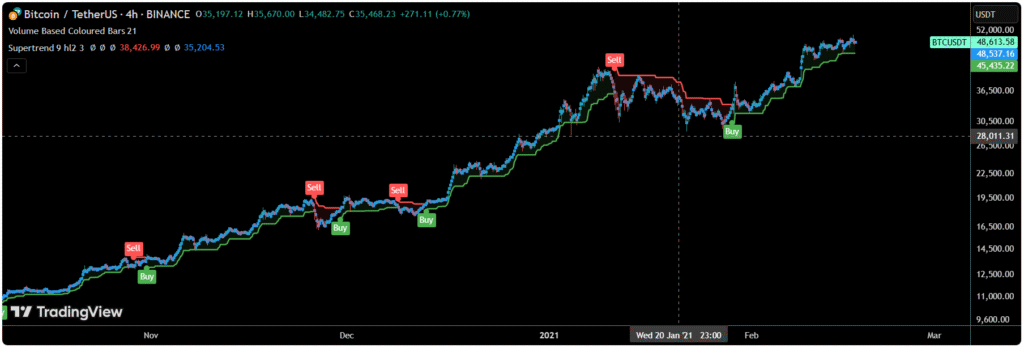
- Description: A trend-following indicator using Average True Range (ATR) to plot dynamic support/resistance levels, changing color to signal trend reversals.
- How it Works: Green lines represent buy signals when the price is above them, while red lines indicate sell signals when the price falls below.
- Best Use Cases: Trend-following strategies and stop-loss placement in trending markets like forex and crypto.
- Popularity: With 55K likes, it’s celebrated for its simplicity and effectiveness (TradingView).
- Why Popular: Its straightforward signals and ATR-based adjustments make it accessible, as noted in [TradeNation]([invalid url, do not cite]).
6. Indicator: WaveTrend Oscillator [WT] [LazyBear]
![Indicator: WaveTrend Oscillator [WT]](https://blog.pickmytrade.io/wp-content/uploads/2025/07/screenshot-20250718-004459-1024x349.png)
- Description: A port of a TS/MT oscillator, it identifies overbought/oversold conditions and generates buy/sell signals based on crossovers.
- How it Works: When the oscillator crosses above the signal line below the oversold band (-60 to -53), it’s a buy signal; crossing below the signal line above the overbought band (53 to 60) is a sell signal.
- Best Use Cases: Momentum trading and spotting reversals in all markets.
- Popularity: With 52.3K likes, it’s valued for its clear signals (TradingView).
- Why Popular: Its similarity to MACD but faster response makes it a favorite for momentum traders.
7. ADX and DI [BeikabuOyaJi]
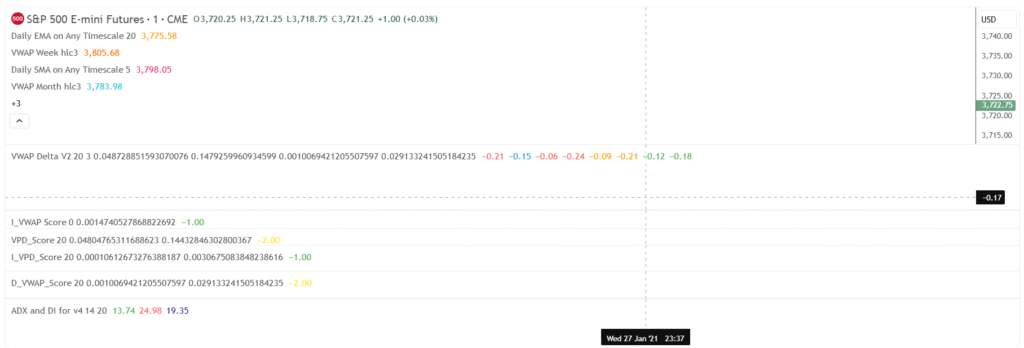
- Description: This indicator plots the Average Directional Index (ADX) with +DI and -DI lines to measure trend strength and direction.
- How it Works: +DI above -DI signals a bullish trend; -DI above +DI signals a bearish trend. ADX above 25 indicates a strong trend.
- Best Use Cases: Confirming trend strength and direction in forex and stocks.
- Popularity: With 41.6K likes, it’s praised for its clarity (TradingView).
- Why Popular: Its straightforward trend analysis is ideal for traders needing to filter weak trends.
8. Bollinger + RSI, Double Strategy (by ChartArt) v1.1
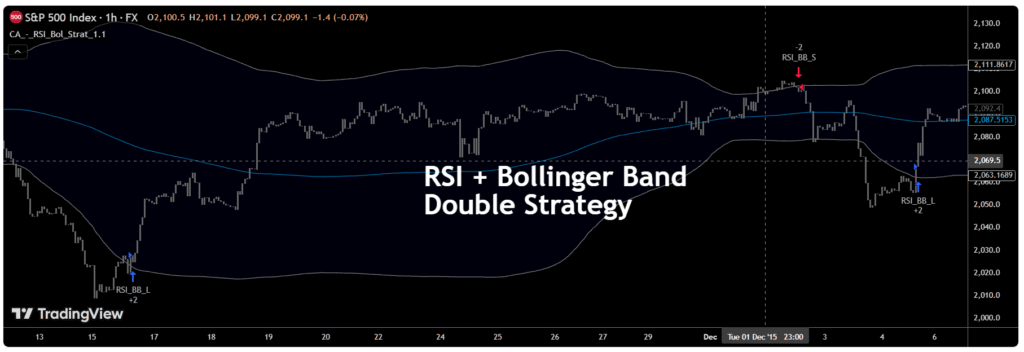
- Description: A strategy combining RSI and Bollinger Bands to generate buy/sell signals when both are in overbought/oversold conditions.
- How it Works: It buys when the price crosses above the lower Bollinger Band and RSI is oversold (<30); it sells when the price crosses below the upper band and RSI is overbought (>70).
- Best Use Cases: Swing trading and range-bound markets in stocks and crypto.
- Popularity: With 38.1K likes, it’s valued for reducing false signals (TradingView).
- Why Popular: Its dual-condition approach enhances reliability, as noted in [Investopedia]([invalid url, do not cite]).
9. CM_Ultimate_MA_MTF_V2 [ChrisMoody]
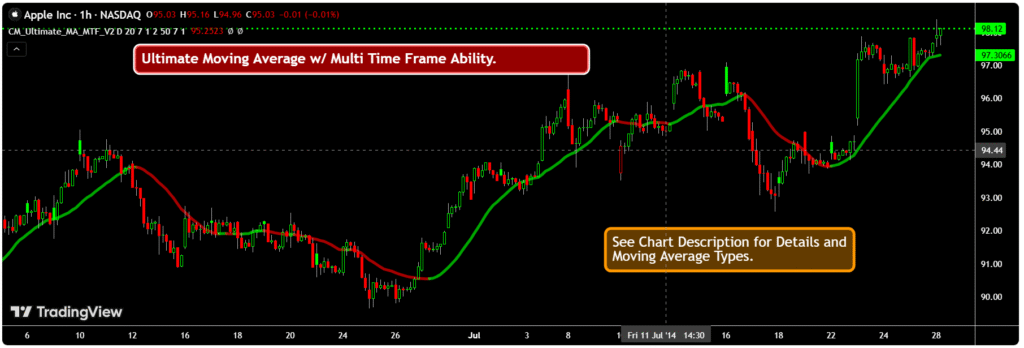
- Description: A customizable moving average indicator supporting multiple timeframes and types (e.g., SMA, EMA, WMA, HullMA, VWMA, RMA, TEMA, Tilson T3).
- How it Works: It plots two moving averages, allowing users to set different timeframes and highlight price crosses with alerts.
- Best Use Cases: Trend analysis and multi-timeframe trading in all markets.
- Popularity: With 35.7K likes, it’s favored for its versatility (TradingView).
- Why Popular: Its support for various moving average types and timeframes makes it highly adaptable.
10. TMA Overlay [ArtyFXC]
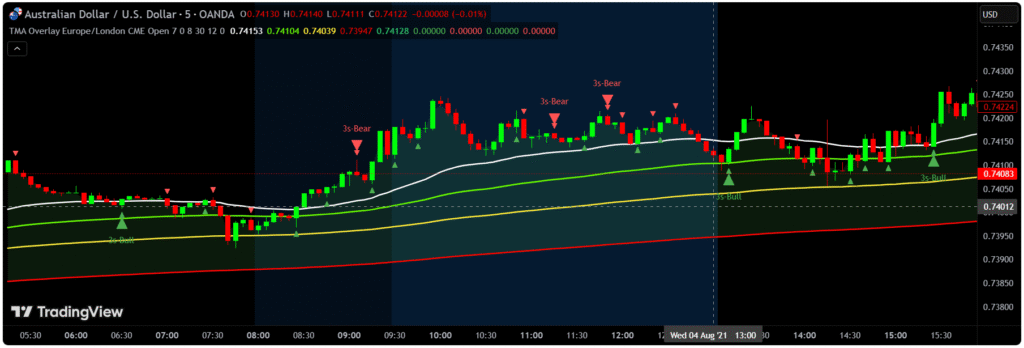
- Description: This indicator overlays smoothed moving averages on the price chart, highlighting engulfing candlestick patterns to identify momentum.
- How it Works: It plots Triangular Moving Averages (TMAs) that adjust dynamically, signaling trend direction and momentum shifts.
- Best Use Cases: Trend identification and momentum trading in forex and stocks.
- Popularity: With 34.3K likes, it’s appreciated for its unique approach (TradingView).
- Why Popular: Its combination of moving averages and price action appeals to traders seeking visual clarity.
11. Support and Resistance Levels with Breaks [LuxAlgo]
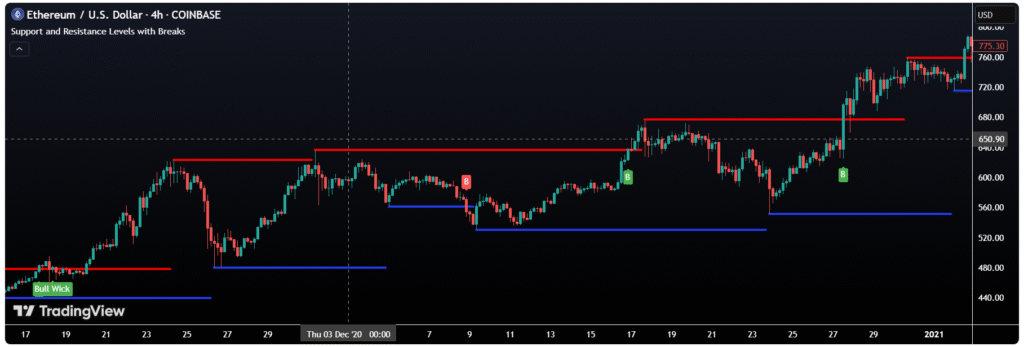
- Description: Identifies key support and resistance levels, highlighting significant breaks using the Volume Oscillator to filter noise.
- How it Works: It plots pivot-based levels and tags breaks with bullish/bearish candles, focusing on high-volume moves.
- Best Use Cases: Breakout trading and support/resistance analysis in all markets.
- Popularity: With 33.8K likes, it’s valued for its clean signals (TradingView).
- Why Popular: Its focus on significant breaks reduces false signals, as noted in [LuxAlgo’s blog]([invalid url, do not cite]).
12. Swing high low support & resistance [Patternsmart]
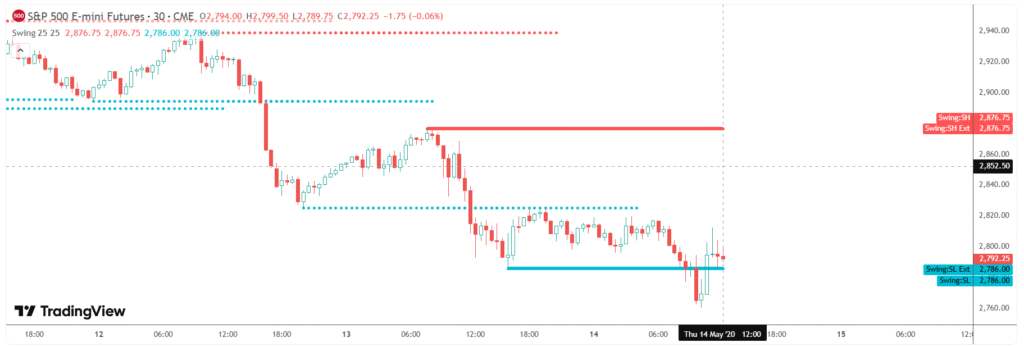
- Description: Plots dot lines for swing points based on a user-defined lookback period, identifying potential support and resistance levels.
- How it Works: It highlights swing highs and lows, signaling potential reversals or continuations when price interacts with these levels.
- Best Use Cases: Swing trading and support/resistance analysis in stocks and forex.
- Popularity: With 33.8K likes, it’s popular for its simplicity (TradingView).
- Why Popular: Its focus on key swing points makes it effective for trend analysis.
| Indicator/Strategy | Type | Best Use Cases | Key Features | Likes |
|---|---|---|---|---|
| Squeeze Momentum Indicator | Volatility | Breakout trading | Bollinger Bands/Keltner Channels, momentum signals | 97.4K |
| Smart Money Concepts (SMC) | Price Action | Institutional analysis, scalping | Order blocks, market structure | 78.2K |
| MacD Custom Indicator | Momentum/Trend | Momentum trading, multi-timeframe | Customizable MACD, cross alerts | 70.4K |
| CM_Williams_Vix_Fix | Volatility | Reversal trading | VIX-based market bottoms | 56.4K |
| SuperTrend | Trend-following | Trend trading, stop-loss | ATR-based signals | 55K |
| WaveTrend Oscillator | Momentum | Reversals, momentum | Overbought/oversold signals | 52.3K |
| ADX and DI | Trend | Trend strength/direction | ADX, +DI, -DI lines | 41.6K |
| Bollinger + RSI, Double Strategy | Volatility/Momentum | Swing trading | Dual-condition signals | 38.1K |
| CM_Ultimate_MA_MTF_V2 | Trend | Multi-timeframe trend analysis | Multiple MA types | 35.7K |
| TMA Overlay | Trend/Momentum | Momentum trading | Smoothed MAs, engulfing patterns | 34.3K |
| Support and Resistance Levels with Breaks | Support/Resistance | Breakout trading | Volume-filtered breaks | 33.8K |
| Swing high low support & resistance | Support/Resistance | Swing trading | Swing point identification | 33.8K |
How to Build Trading Plans with Top Free TradingView Indicators
These indicators can be combined into effective trading strategies:
- Squeeze Momentum Strategy: Enter trades on gray cross after a black cross, confirming direction with volume or RSI.
- SMC with Volume Profile: Use SMC’s order blocks with Volume Profile HD to confirm high-volume support/resistance zones.
- MACD and SuperTrend Combo: Combine MACD crossovers with SuperTrend signals for trend confirmation.
- Bollinger + RSI Strategy: Follow the double strategy’s buy/sell signals, using ATR for stop-loss placement.
- ADX with Moving Averages: Use ADX to confirm trend strength before entering trades based on CM_Ultimate_MA_MTF_V2 crossovers.
Limitations of Using Free TradingView Indicators and Strategies
While these tools are popular, they have limitations:
- False Signals: Indicators like RSI and MACD may produce false signals in trending markets, as noted on Reddit’s r/TradingView.
- Market Dependency: SuperTrend struggles in sideways markets, and SMC requires practice due to its complexity.
- Lagging Nature: Indicators like moving averages and MACD are based on historical data, which can result in delayed trade signals.
- Community Feedback: Traders recommend combining indicators (e.g., Squeeze Momentum with ADX) to improve accuracy and backtesting thoroughly.
How to Use These Indicators
To apply these indicators on TradingView:
- Open a chart on TradingView.
- Click the “Indicators” button at the top.
- Search for the indicator by name (e.g., “Squeeze Momentum Indicator”).
- Add it to your chart and adjust settings (e.g., period length) if needed.
- Use TradingView’s Strategy Tester to backtest strategies.
- Practice on a demo account before trading live.
Conclusion
In conclusion, the top free TradingView indicators and strategies provide a reliable foundation for smarter trading decisions across all markets. Whether you’re a beginner or advanced trader, tools like Squeeze Momentum, Smart Money Concepts, and SuperTrend offer data-driven insights with proven popularity. Explore them in TradingView’s public library to enhance your strategy today.
Take It Further: Automate Your TradingView Strategies with PickMyTrade
Once you’ve chosen the right indicator or strategy on TradingView, the next challenge is execution especially if you’re managing multiple accounts or working through prop firm evaluations. Manual execution can lead to slippage, missed signals, and inconsistent results.
That’s where PickMyTrade comes in.
PickMyTrade connects directly to your TradingView strategies, enabling real-time, automated trade execution across supported brokers. No coding. No delays. Just reliable automation that keeps your strategy running exactly as intended.
Whether you’re scalping, swing trading, or running a fully automated system, PickMyTrade supports:
- Live and demo execution
- Multiple broker integrations including Rithmic, TradeStation, Interactive Brokers, and TradeLocker
- Lightning-fast strategy execution with zero lag from TradingView alerts
To start automating your TradingView strategies, visit PickMyTrade.io.
Using Tradovate? Head to PickMyTrade.trade for seamless Tradovate integration.
You May also Like:
Top TradingView Strategies Ranked: Which One Performs Best?
Repainting vs Non-Repainting Indicators in Futures Trading