In the fast-paced world of financial markets, order flow trading analysis provides a powerful edge by revealing the real-time buying and selling pressures that drive price movements. Unlike traditional technical analysis, which relies on historical patterns, order flow trading analysis dives into the microstructure of the market, helping traders anticipate shifts with greater accuracy. This comprehensive guide, updated for 2026, targets retail traders, algo traders, prop traders, and trading educators looking to enhance their strategies. We’ll explore core concepts, advanced techniques, and how to automate them using PickMyTrade for seamless execution.
What Is Order Flow Trading Analysis?
Order flow trading analysis examines the continuous stream of buy and sell orders entering the market, offering insights into participant behavior and market intentions. At its core, it tracks how orders interact with supply and demand, creating detectable patterns that signal potential price changes. For instance, institutional traders often leave “footprints” through large order clusters, which savvy traders can interpret to predict breakouts or reversals.
This approach has evolved significantly in recent years. As of November 2025, a Federal Reserve study highlighted how order flow imbalances amplified price movements in U.S. Treasury markets during the April 2025 turbulence, underscoring its relevance in volatile environments [Federal Reserve, Nov 3, 2025]. By focusing on real-time data, traders can make informed decisions beyond mere candlestick charts.
Key Components of Market Microstructure
Understanding order flow trading analysis starts with market microstructure elements like bid-ask spreads, order book depth, and trade execution timing. These reveal hidden liquidity and large player activity. For example, a widening spread might indicate upcoming volatility, while deep order books suggest strong support or resistance levels.
Essential Tools for Order Flow Trading Analysis
To effectively conduct order flow trading analysis, traders rely on specialized tools that visualize data in actionable ways.
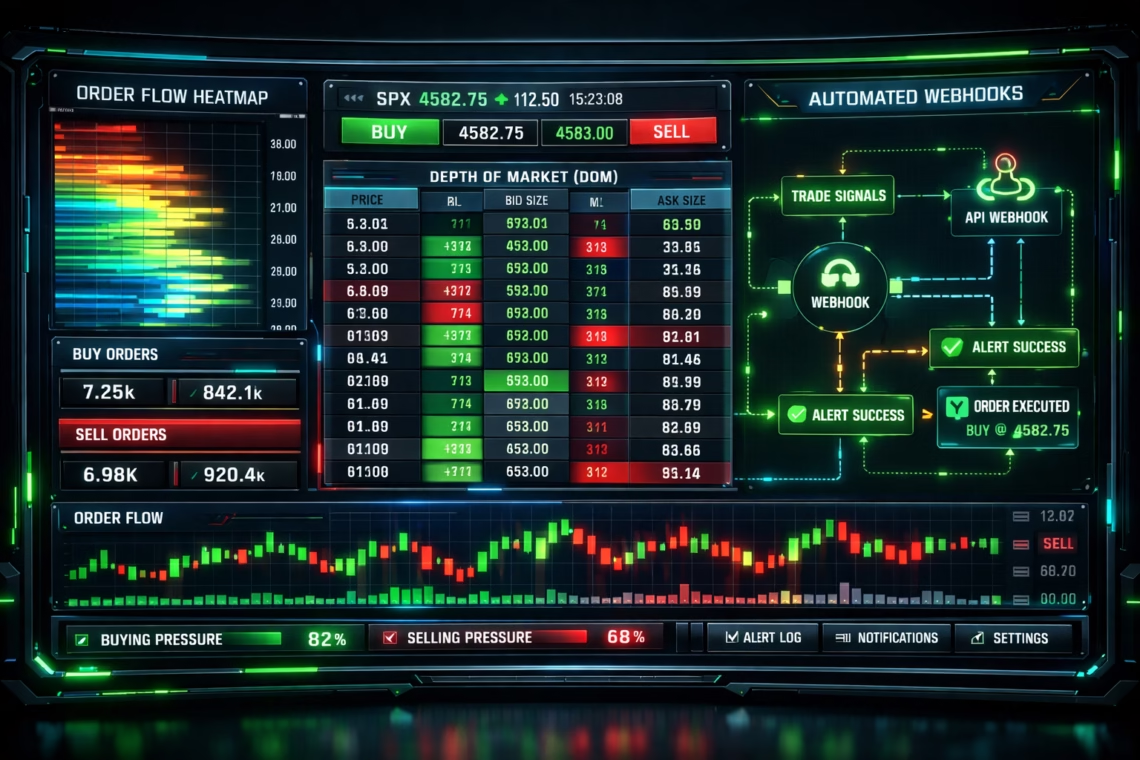
Depth of Market (DOM) and Dynamic Patterns
The Depth of Market (DOM) displays pending orders on both sides of the book, helping identify imbalances. A cluster of buy orders at a key level could signal accumulation, while rapid cancellations might point to spoofing—a manipulative tactic where fake orders are placed to mislead the market.
Recent advancements include AI-enhanced DOM tools that automatically detect patterns, as noted in a 2025 Oreate AI analysis, which emphasized their role in derivatives trading [Oreate AI Blog, Jan 7, 2026].
Footprint Charts and Volume Distribution
Footprint charts break down volume within each candlestick by price level, showing buy/sell aggression. Look for imbalances where buying volume dominates at the highs, indicating potential upward momentum. A 2026 guide from LiteFinance stresses using these for intraday strategies, with updates incorporating machine learning for pattern recognition [LiteFinance, Jan 6, 2026].
Advanced Techniques in Order Flow Trading Analysis
Building on basics, advanced methods integrate multiple indicators for robust strategies.
Delta Divergence and Cumulative Delta
Delta measures the net difference between buy and sell volume. A divergence—such as rising prices with negative delta—often foreshadows reversals due to hidden selling pressure. Cumulative delta tracks this over time, confirming trend strength.
Absorption Patterns and Market Profile
Absorption occurs when large volumes are traded without significant price shifts, signaling institutional involvement. Combine this with Market Profile’s value areas (where 70% of volume occurs) to pinpoint fair value zones. Points of Control (POCs) from prior sessions act as magnets for price.
Automating Order Flow Trading Analysis with PickMyTrade
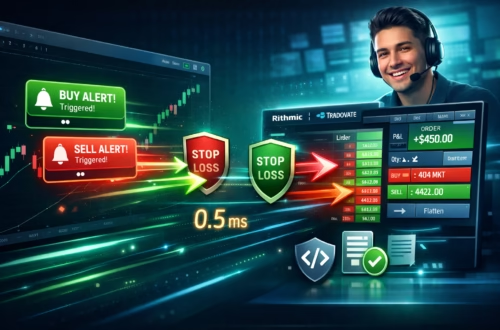
Automation turns order flow trading analysis insights into hands-free execution. Instead of manual monitoring, connect your analysis tools to PickMyTrade, which bridges TradingView alerts to brokers like Tradovate, Rithmic, or Interactive Brokers via webhooks.
In conclusion, mastering order flow trading analysis can transform your trading by uncovering hidden market dynamics. With tools like PickMyTrade, you can automate these insights for consistent results.
Discover the power of automation today—Get a 5 day Free Trial of Trading Automation and elevate your trading game.
Most-Asked FAQs
It’s a method to analyze buy/sell orders in real-time to predict price moves based on market microstructure.
Order flow focuses on actual trades and orders, while technical analysis uses historical price patterns.
Start with DOM and footprint charts on platforms like TradingView or Sierra Chart.
Yes, use PickMyTrade to connect TradingView alerts to brokers for automated execution.
Ignoring divergences or manipulation can lead to false signals; always cross-verify.
Disclaimer:
This content is for informational purposes only and does not constitute financial, investment, or trading advice. Trading and investing in financial markets involve risk, and it is possible to lose some or all of your capital. Always perform your own research and consult with a licensed financial advisor before making any trading decisions. The mention of any proprietary trading firms, brokers, does not constitute an endorsement or partnership. Ensure you understand all terms, conditions, and compliance requirements of the firms and platforms you use.
Also Checkout: Optimize Crypto Bot Routing: Reduce Slippage & Max Fills