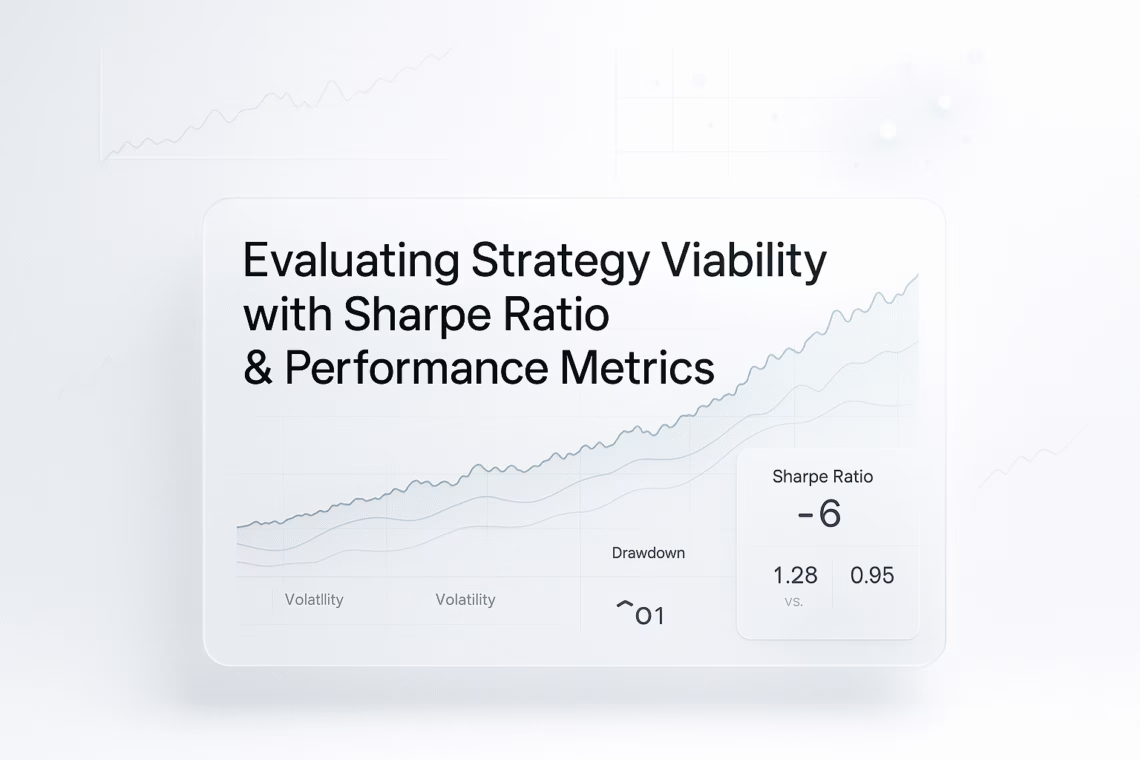
Evaluating strategy viability with Sharpe Ratio is one of the most reliable ways to understand whether a trading approach truly performs well on a risk-adjusted basis. In this guide, we break down the Sharpe Ratio and complementary performance metrics so you can analyze real strategy health with confidence.
In this post, we’ll dive deep into the Sharpe Ratio: what it is, how to calculate and apply it, and why it’s a game-changer for assessing strategy health. But we won’t stop there. While the Sharpe Ratio is a powerhouse, it’s not a solo act. We’ll explore its limitations and pair it with complementary metrics like drawdowns, Sortino Ratio, and more to paint a complete picture. By the end, you’ll have a practical framework to determine if your strategy is ready for the real world sustainable, efficient, and aligned with your risk tolerance.
What is the Sharpe Ratio?
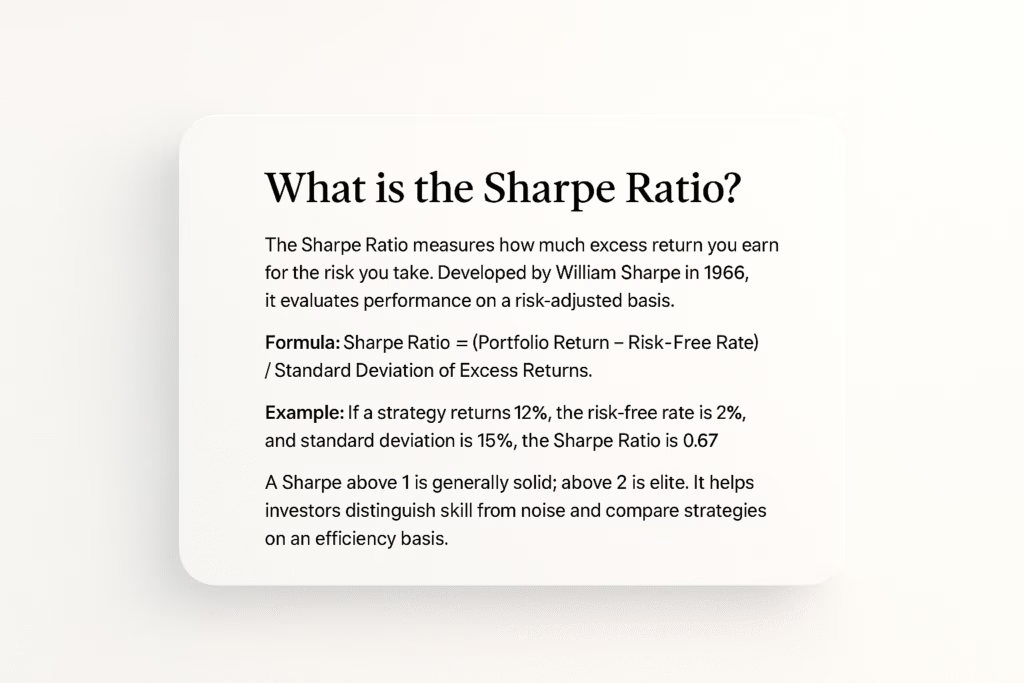
At its core, the Sharpe Ratio is a simple yet profound measure of how much extra return you’re earning for the risk you’re taking. Developed by Nobel laureate William Sharpe in 1966, it quantifies performance on a risk-adjusted basis, helping investors separate skill from luck.
The formula is straightforward:
Sharpe Ratio = (Portfolio Return – Risk-Free Rate) / Standard Deviation of Excess Returns
Here’s a quick breakdown: The numerator captures the “excess return” your strategy’s gains minus a baseline like the yield on a 3-month U.S. Treasury bill (the risk-free rate). The denominator is the standard deviation, a statistical gauge of volatility or how much returns swing around the mean. Divide them, and you get a ratio that essentially asks: “For every unit of risk, how much reward do you get?”
Let’s walk through an example. Suppose your trading strategy returned 12% annually, while the risk-free rate is 2%. That’s an excess return of 10%. If the standard deviation of those excess returns is 15%, your Sharpe Ratio is 10% / 15% = 0.67. Not stellar, but it’s a starting point. (For a deeper dive on the math, check out Investopedia’s guide.)
Why does this matter? Markets are noisy, and high returns can mask high risks. The Sharpe Ratio normalizes that noise, offering a lens on efficiency. A score above 1 is generally considered solid meaning you’re earning more than your risk costs you. Push past 2, and you’re in elite territory, with returns far outpacing volatility. These benchmarks come from industry wisdom, like insights from Kotak Mutual Fund, but remember: context is king. What’s “good” for a conservative bond strategy might underwhelm a high-frequency trader.
Using the Sharpe Ratio to Evaluate Strategy Viability
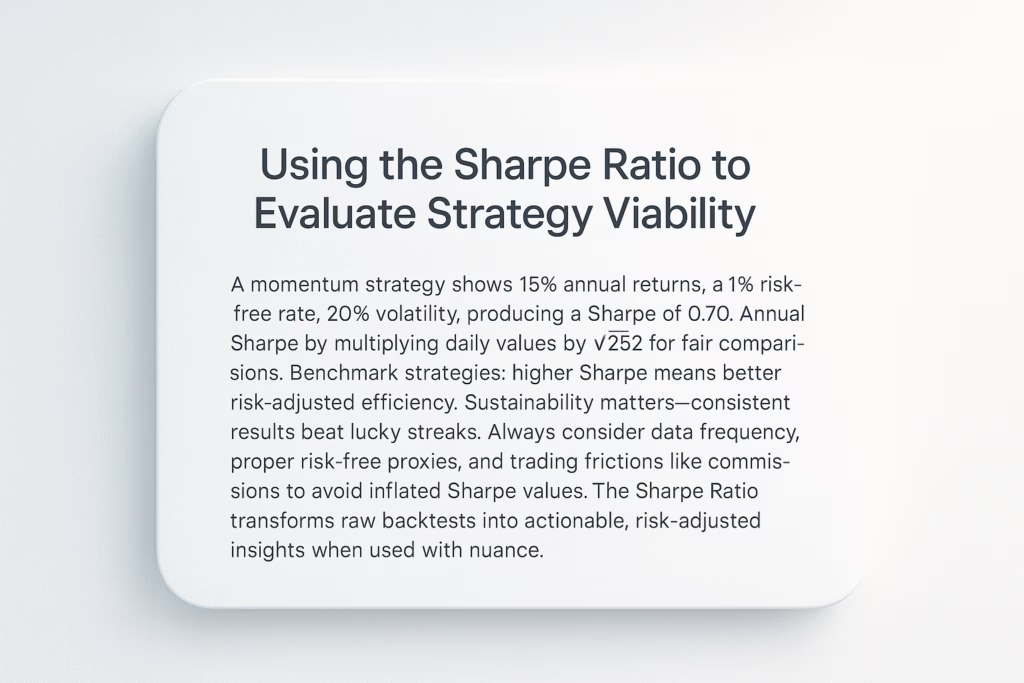
Now that we’ve got the basics, let’s put the Sharpe Ratio to work. Imagine you’ve backtested a momentum-based equity strategy over five years of daily data. Annualized returns clock in at 15%, risk-free rate at 1%, and volatility at 20% yielding a Sharpe of 0.70. Is this viable? Time to apply it systematically.
First, annualize if needed. For daily data, multiply the raw Sharpe by the square root of 252 (trading days in a year) to scale it up. This gives an apples-to-apples comparison across time frames. A higher annualized Sharpe signals stronger risk-adjusted performance, hinting at a strategy that generates consistent alpha without wild rides.
Next, benchmark against peers. If Strategy A has a Sharpe of 1.2 and Strategy B scores 0.8 under similar conditions (same asset class, timeframe), A wins on efficiency. It’s not just about picking winners it’s about allocating capital to the most bang-for-your-risk-buck option.
Sustainability is the real test. A lofty Sharpe isn’t a fluke detector; it suggests your edge is robust, not reliant on one bull market or lucky streak. But always layer in context: What’s the data frequency? Daily returns amplify noise, while monthly smooths it out. Are you using the right risk-free proxy? And crucially, have you baked in real-world frictions like commissions? As QuantStart emphasizes, ignoring these can inflate your ratio, setting you up for disappointment in live trading.
In short, the Sharpe Ratio turns abstract backtests into actionable insights, but it’s most powerful when wielded with nuance.
Beyond Sharpe: Other Performance Metrics to Complement It
Relying solely on the Sharpe Ratio is like judging a book by its cover informative, but incomplete. Volatility treats ups and downs the same, so a strategy with frequent small wins and rare crashes might score well, even if those crashes could wipe you out. To build a fuller evaluation, weave in these metrics:
- Maximum Drawdown: This tracks the steepest drop from peak to trough in your equity curve. A 5% drawdown is tolerable for most, but 30%? That’s a red flag, regardless of Sharpe. It directly ties to psychological and capital preservation sites like utradealgos.com stress how even a “good” Sharpe can hide drawdown disasters.
- Win Rate / Trade Accuracy: Simple but telling: What percentage of trades profited? A 60% win rate with solid risk-reward ratios screams consistency, while a 40% rate might demand deeper scrutiny.
- Raw Volatility (Standard Deviation): Sharpe embeds this, but examining it standalone reveals the absolute risk level. Low vol with decent returns? Gold. High vol? Proceed with caution.
- Sortino Ratio: Sharpe’s smarter sibling, it divides excess returns by downside deviation only ignoring upside swings. Ideal for strategies where you fear losses more than you celebrate gains (Investopedia has a great explainer).
- Skewness, Kurtosis, and Tail Risks: Markets aren’t bell-curves; they have fat tails (extreme events). Positive skew means more upside surprises, while high kurtosis flags outlier risks. Wikipedia dives into how these expose Sharpe’s blind spots in non-normal distributions.
- Alpha, Beta, and Information Ratio: If benchmarking against an index (e.g., S&P 500), alpha shows your unique edge, beta measures market sensitivity, and the information ratio refines Sharpe by focusing on tracking error.
- Transaction Costs and Slippage: Backtests often gloss over these, but in reality, they erode returns. A strategy’s “paper” Sharpe of 1.5 might drop to 0.8 after fees QuantStart warns this gap can kill viability.
Together, these metrics create a dashboard: Sharpe for efficiency, drawdown for safety, Sortino for asymmetry, and costs for realism.
Interpreting Metrics: What Makes a Strategy Viable?
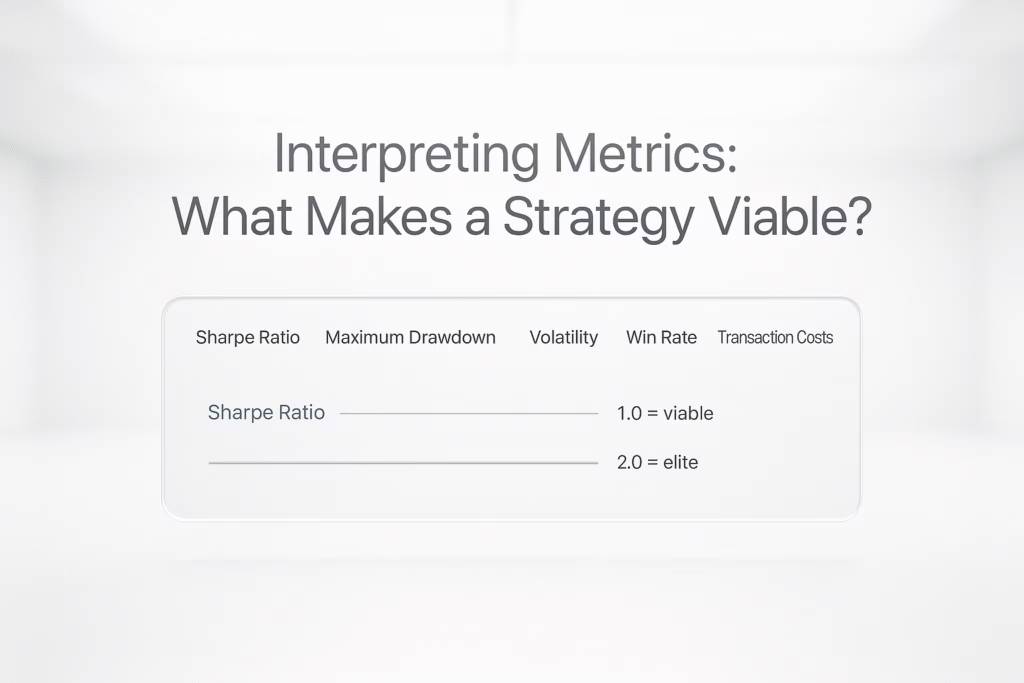
So, when do the numbers add up to “deploy”? Viability boils down to a strategy that delivers reliable, risk-adjusted returns without breaking the bank on costs or your nerves on drawdowns. It’s sustainable execution in varied markets, backed by clean data.
Set thresholds wisely: For quant shops, a post-cost Sharpe above 1 is table stakes; elite teams chase 2+. But numbers aren’t absolute consistency trumps spikes. A strategy shining in 2020’s volatility but crumbling in 2023’s chop? Pass. QuantStart notes how regime shifts expose frailties.
Beware overfitting: That pristine backtest Sharpe? It might be curve-fitted to history, ignoring look-ahead bias (peeking at future data). ArXiv papers on quant finance highlight how this inflates metrics always validate with out-of-sample tests.
Ultimately, viability is holistic. A Sharpe of 1.1 with 5% max drawdown and steady wins might outshine a 1.8 flasher with 25% plunges. Align it to your profile: conservative? Prioritize low vol. Aggressive? Tolerate drawdowns for alpha.
Common Pitfalls & Limitations of the Sharpe Ratio
No metric is flawless, and the Sharpe Ratio has its Achilles’ heels. It assumes normally distributed returns, but real markets skew toward drama fat tails mean rare black swans that Sharpe underplays (QuantStart calls this out sharply).
It lumps upside and downside vol together, blind to the asymmetry that keeps us up at night. Short horizons amplify sampling errors; a one-year Sharpe might mislead more than a decade’s. QuantInsti Blog details how frequency tweaks can swing results wildly.
Past performance? No crystal ball yesterday’s 1.5 doesn’t promise tomorrow’s. And multiple testing: Scan 100 strategies, pick the Sharpe champ, and you’ve got selection bias. Enter the Deflated Sharpe Ratio, which dials it back for “luck” (Wikipedia covers this adjustment).
Dodge these by diversifying your toolkit don’t let Sharpe be the tail wagging the dog.
Practical Steps: How to Apply This in Your Strategy Evaluation
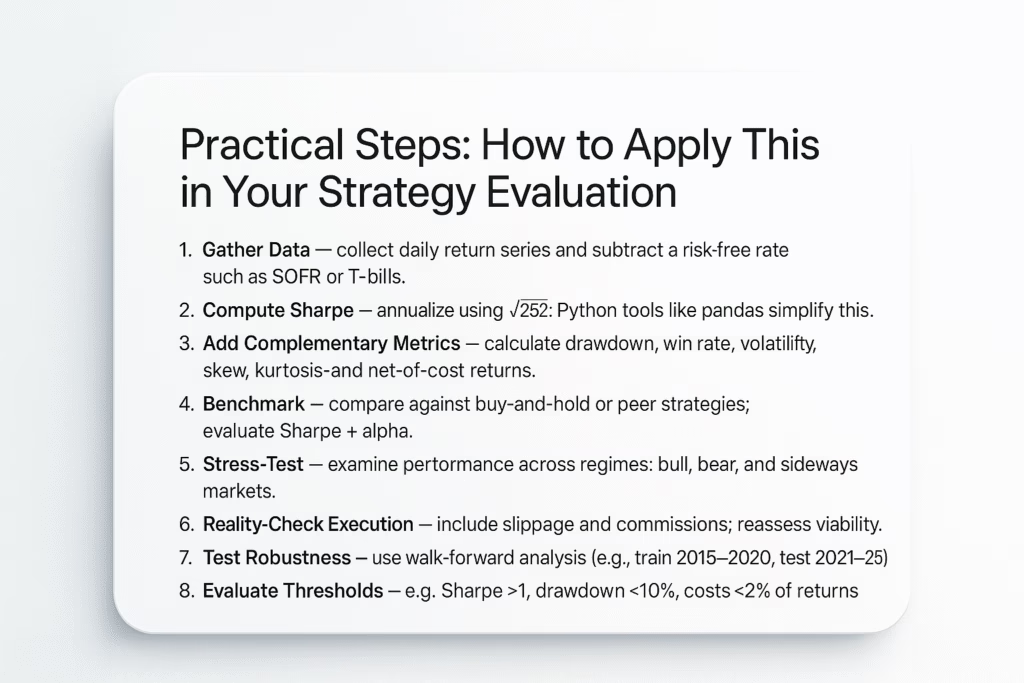
Theory’s great, but execution wins. Here’s a step-by-step playbook:
- Gather Data: Pull returns series (daily preferred for granularity), subtract the risk-free rate (e.g., SOFR or T-bills).
- Compute Sharpe: Annualize via √252 for dailies. Tools like Python’s pandas make this a breeze.
- Layer in Complements: Calc drawdown (peak-to-trough scan), win rate (profitable trades/total), vol, skew/kurtosis via libraries like SciPy, and net-of-cost returns.
- Benchmark Ruthlessly: Stack against buy-and-hold or peers. Does your Sharpe + alpha beat the market’s?
- Stress-Test: Slice data by regime bull (e.g., 2021), bear (2022), sideways. How’s the Sharpe holding?
- Reality-Check Execution: Add 0.1% slippage per trade, commissions. Recalc metrics viability shrinks fast here.
- Probe Robustness: Walk-forward optimize: Train on 2015-2020, test 2021-2025. Consistent Sharpe? Green light.
- Call It: Weigh against your thresholds. Sharpe >1, drawdown <10%, costs <2% of returns? Viable. Tweak or trash otherwise.
This framework turns evaluation from art to science.
Concluding Thoughts
The Sharpe Ratio isn’t just a number it’s a North Star for strategy sanity, distilling risk-reward into one digestible score. Yet, as we’ve seen, it’s most potent in ensemble: paired with drawdowns for resilience, Sortino for nuance, and cost audits for truth.
Build your evaluation ritual around this full spectrum consistency, robustness, and realism over any single stat. In an era of AI-driven edges and regime-shifting markets, we’ll lean harder on tails, deflation adjustments, and beyond. Start simple: Run these metrics on your next idea. Your portfolio will thank you.
What metrics guide your trades? Drop a comment let’s sharpen each other.
Start Automating Smarter
For traders looking to automate trading strategies, PickMyTrade offers seamless integrations with multiple platforms. You can connect Rithmic, Interactive Brokers, TradeStation, TradeLocker, or ProjectX through pickmytrade.io.
If your focus is Tradovate automation, use pickmytrade.trade for a dedicated, fully integrated experience. These integrations allow traders to execute strategies automatically, manage risk efficiently, and monitor trades with minimal manual intervention.
You May also like:
Volume-Based Automated Trading Strategies for Futures
Algorithmic Trading for Retail Investors: A Complete Guide
Technical Indicators for Algorithmic Trading on PickMyTrade: The Complete Guide for 2025
Complete Guide to Automated Futures Trading Systems with PickMyTrade
Top Trading Indicators Tools to Enhance Your Strategy in 2025
Effective Backtesting Strategies for Trading Success
Auto Trading Bots: Enhance Your Trading Strategy
Convert TradingView Indicator to Strategy with AI