Technical indicators are an essential tool for traders in the futures markets. Whether you’re trading the Nasdaq-100 (NQ), crude oil (CL), or other instruments via professional platforms like Rithmic, the precision of your signals can determine your profitability. However, one critical issue that can mislead even experienced traders is the use of repainting indicators.
In this article, we’ll explore what repainting indicators are, why they matter in live trading, and how traders using Rithmic and other advanced software platforms can avoid their pitfalls.
What is a Repainting Indicator?
A repainting indicator alters previously displayed values on a chart when new market data becomes available. This can result in historical signals that look flawless — showing ideal entries and exits that align perfectly with market tops and bottoms. The problem is that these signals often didn’t exist in real time.
In practice, repainting creates the illusion of a highly accurate strategy, but when used for live trading, it can generate late or completely false signals.
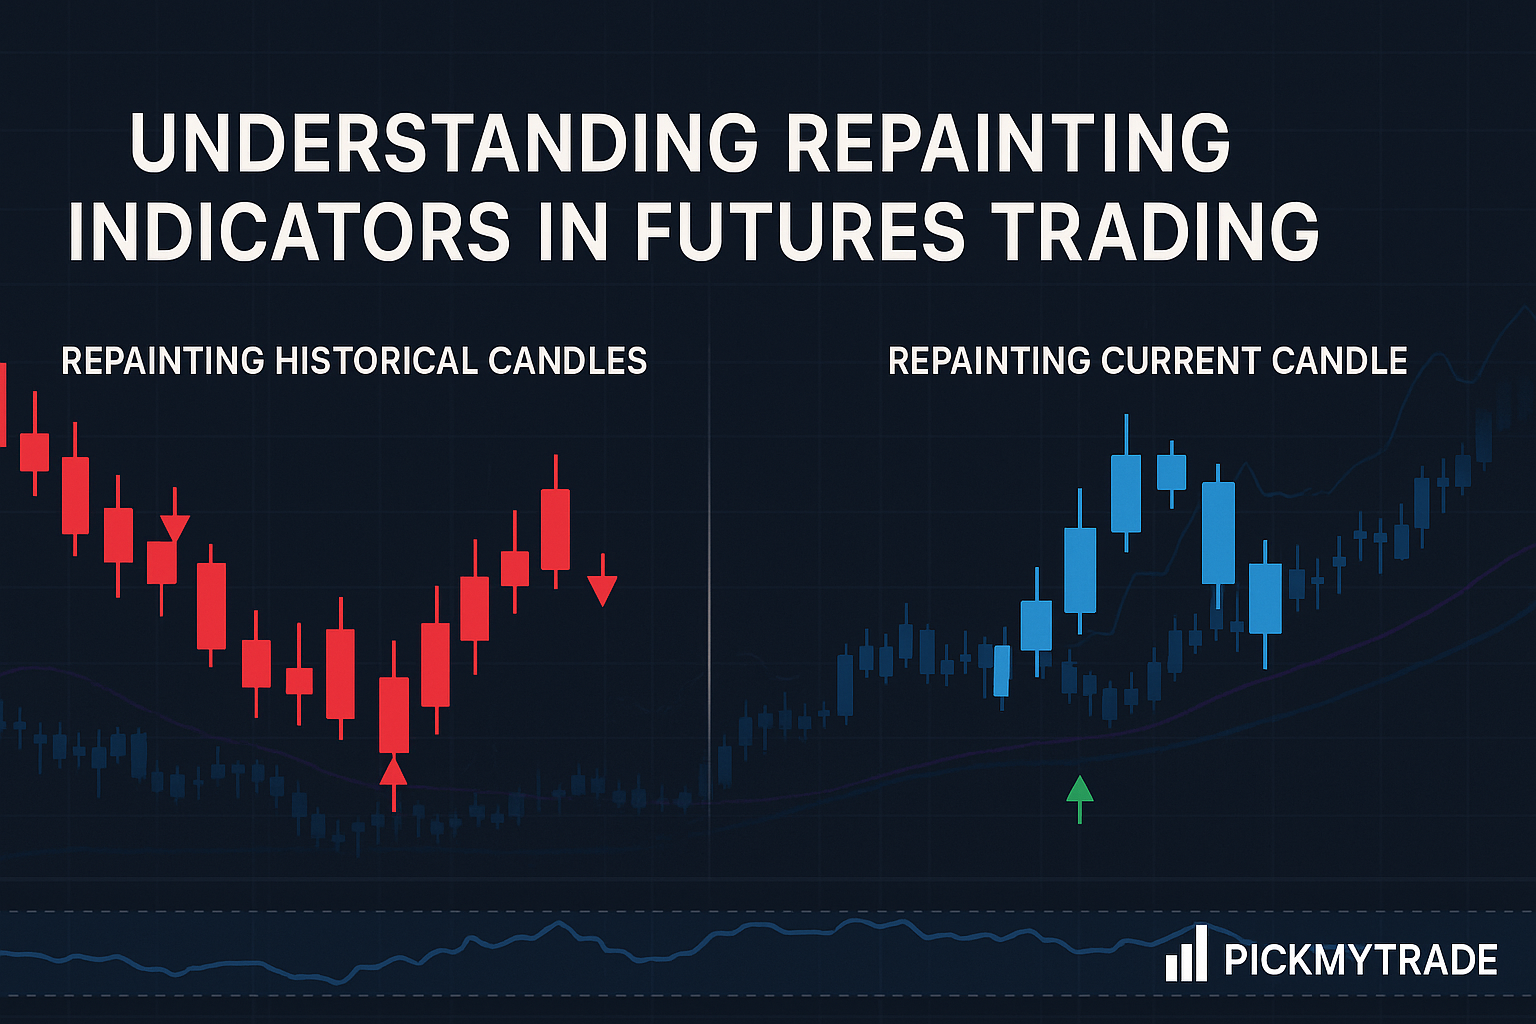
There are two major types of repainting behavior:
1. Repainting the Current Candle
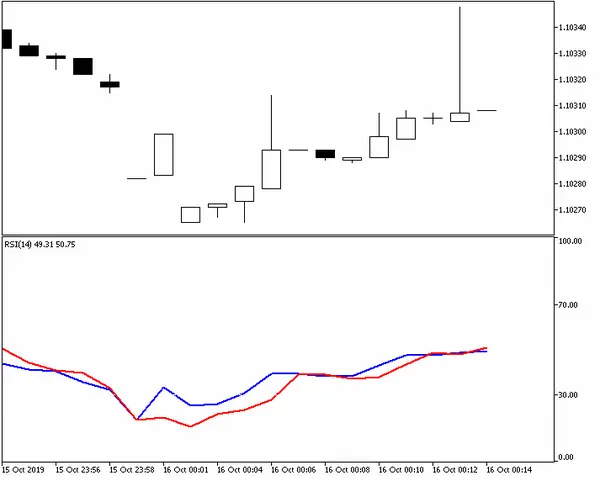
This is relatively common and not inherently problematic. Most indicators, including Moving Averages and RSI, update in real-time as the current candle is still forming. For example, if an indicator is calculated based on the close price, its value will continue changing until the candle closes. This is expected behavior and does not usually mislead traders who wait for candle confirmations.
2. Repainting Historical Candles
This is where the issue becomes critical. Indicators that alter past signals based on future price data are often coded to look perfect in hindsight. In reality, such indicators are unusable for live trading because they reference price action that hasn’t happened yet.
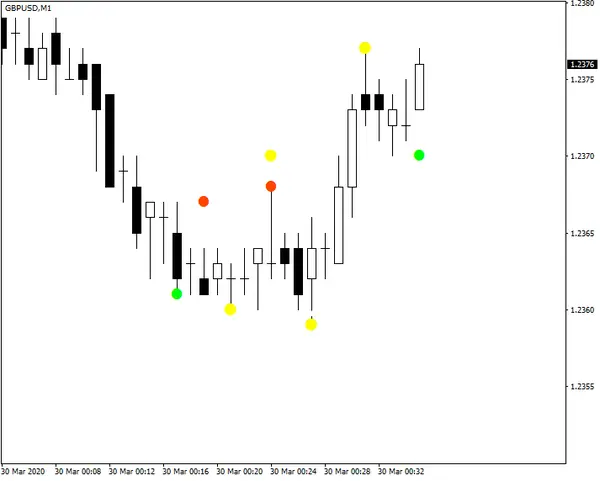
A common example is a custom ZigZag or Semafor indicator that draws turning points based on future highs and lows. While they appear highly accurate on historical charts, these signals are not tradeable in real time.
Repainting in Rithmic-Based Futures Platforms
Rithmic is known for its ultra-low latency and direct market access, making it a popular choice among futures traders and prop firms. However, repainting indicators are not a platform issue, but rather a Pine Script, EasyLanguage, or MQL-level coding behavior that can affect your strategy no matter how fast your execution is.
Here’s how repainting manifests in a Rithmic-powered setup:
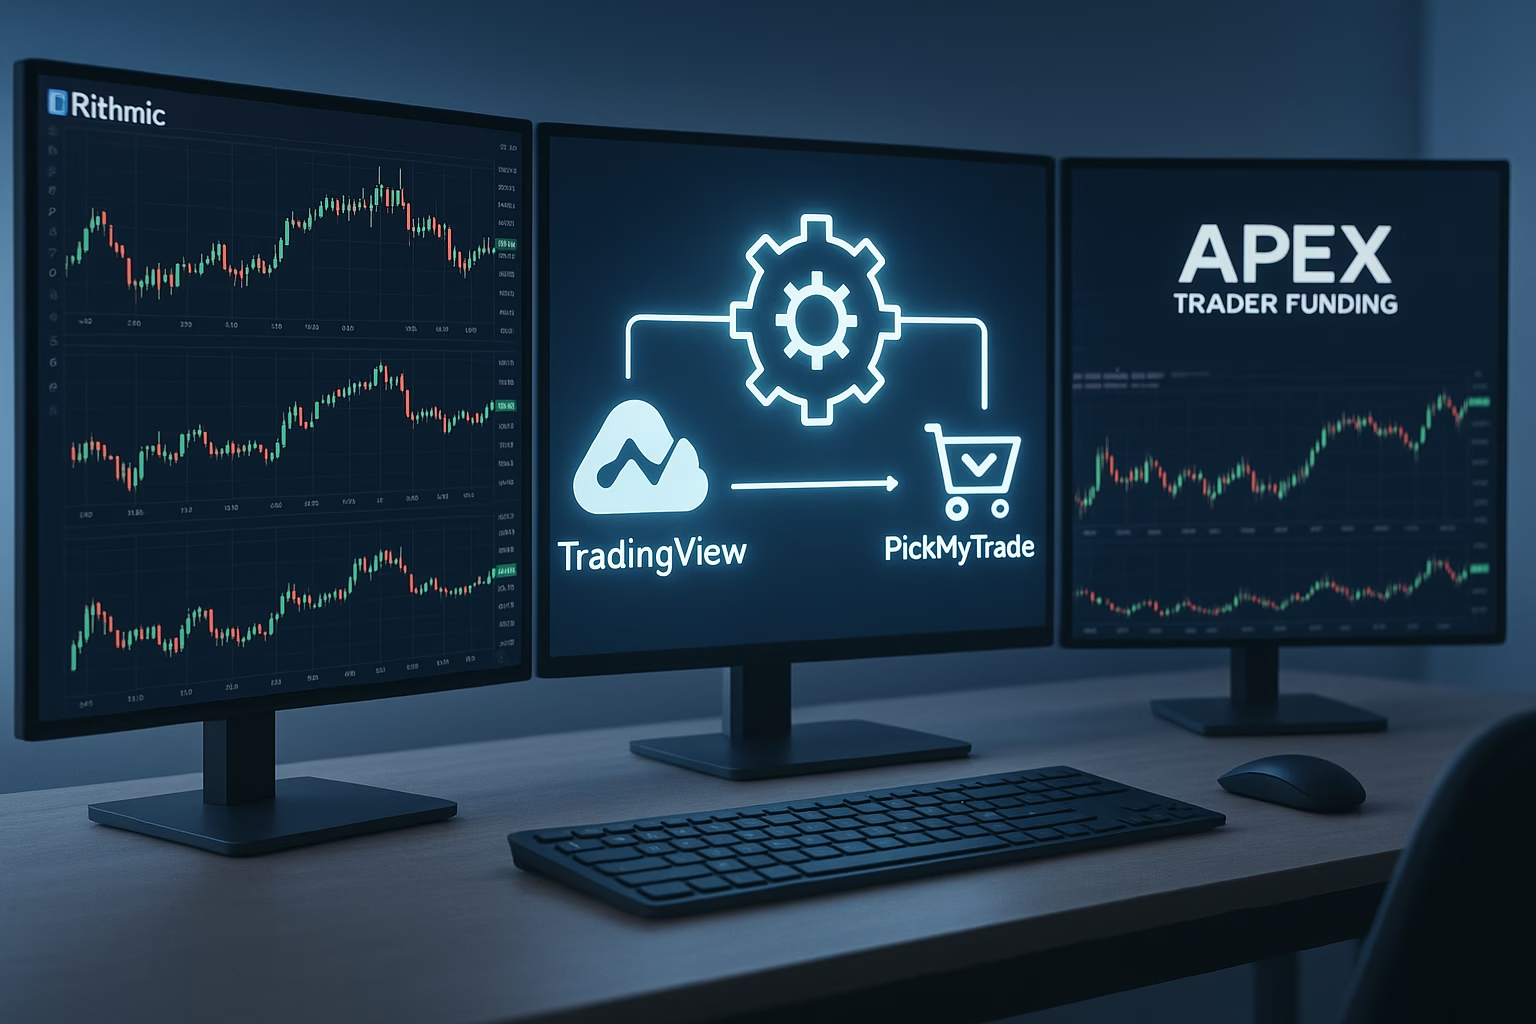
- You may use a TradingView or MultiCharts strategy connected to Rithmic for execution via PickMyTrade.
- The indicator fires perfect signals during backtests.
- But in live markets, entries lag or vanish entirely.
The disconnect lies in the fact that some indicators read future candles to determine their signals, which cannot occur in real-time. This results in backtests that look ideal, but forward tests that underperform.
Real-World Example: Center of Gravity on NQ
Consider a futures trader applying the Center of Gravity indicator to NQ (Nasdaq-100 futures) on a 5-minute chart via a TradingView-Rithmic integration.
- In backtesting, the indicator shows ideal reversal zones, catching nearly every top and bottom.
- In live trading, the zones appear late or shift retroactively as the session progresses.
This occurs because the indicator calculates its output based on a rolling window of future bars — something only possible in historical mode.
The result? Backtests may look promising, but live performance often fails to meet expectations.
How to Detect a Repainting Indicator
If you’re using Rithmic through platforms like PickMyTrade or TradingView, here’s how to verify whether an indicator repaints:
- Use Strategy Tester or Replay Mode
On platforms like TradingView, use the bar-by-bar replay tool and see if signals change retroactively as new candles appear. - Observe Behavior in Live Markets
Run your strategy with paper trading. If signals from earlier candles shift or disappear when new data comes in, it’s repainting. - Review the Code (if available)
If the indicator relies on future bar references likeclose[1],high[2], or non-fixed lookaheads, it likely repaints. - Ask the Developer Directly
If you’re purchasing a custom indicator, request confirmation on whether it repaints and ask for a live demo or visual backtest.
Can Repainting Indicators Still Be Useful?
Yes, but only when used for analysis, not execution.
Indicators like ZigZag and Semafor are well-suited for mapping market structure, identifying support and resistance areas, and highlighting significant swing points. Traders can use them to manually draw levels or define trade bias, but not for timing actual entries.
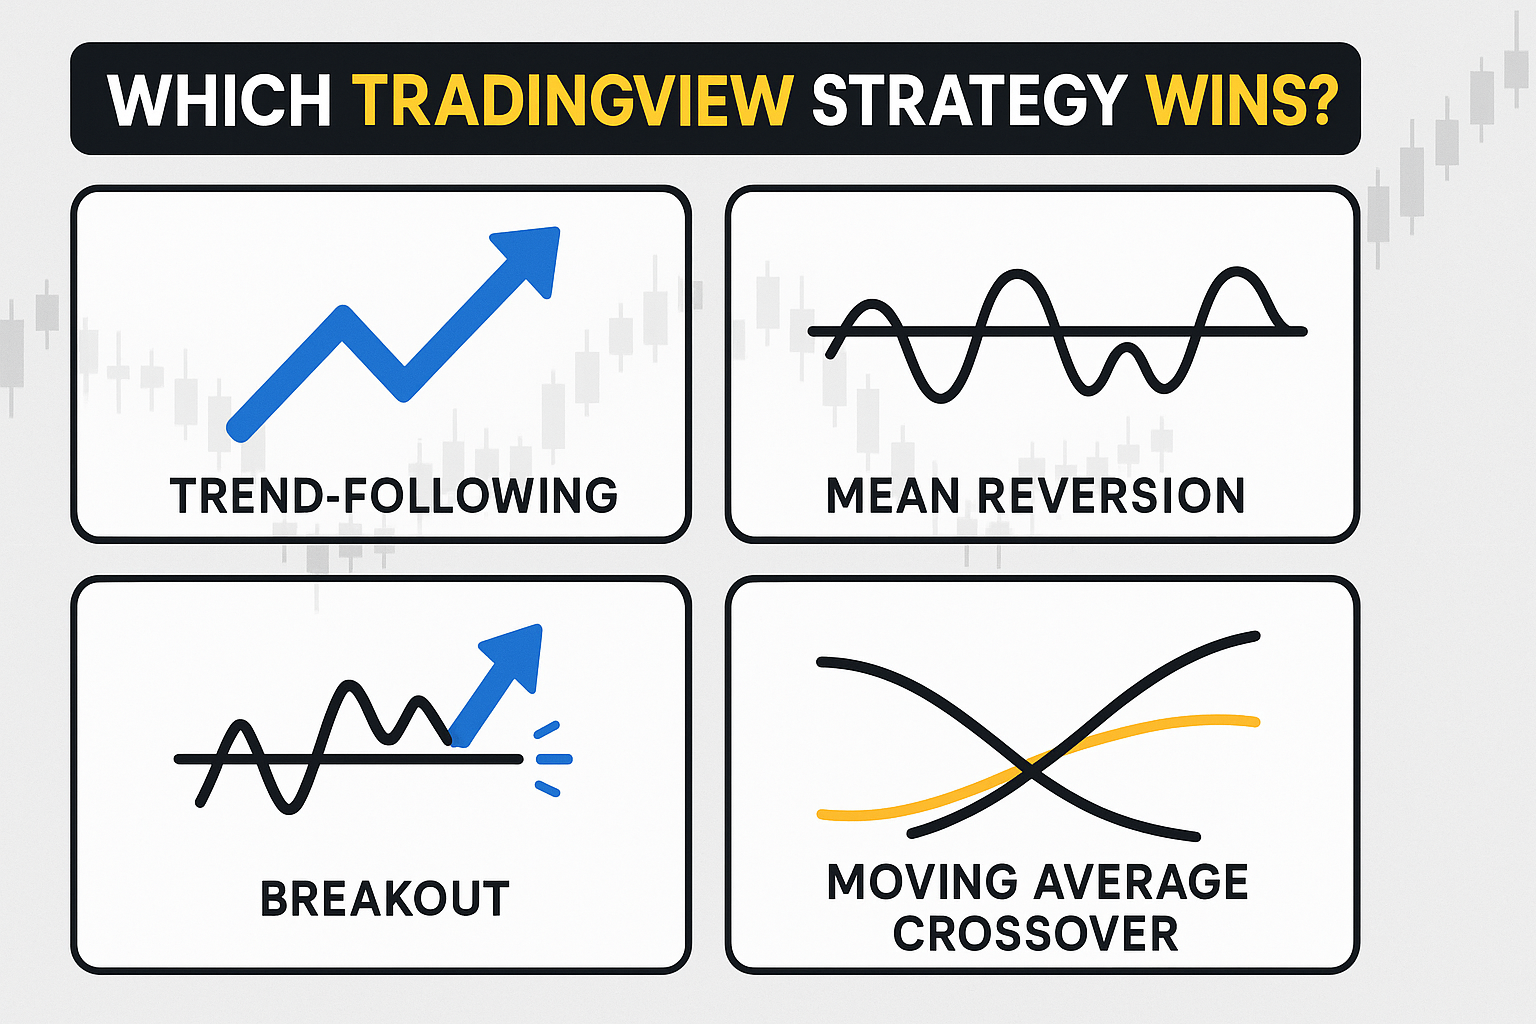
In contrast, non-repainting indicators such as Moving Averages, RSI, MACD, and Keltner Channels provide stable signals that can be relied on for automation or execution.
Final Thoughts: Know Before You Automate
Before integrating any technical indicator into an automated trading system — whether it’s through TradingView, MultiCharts, or PickMyTrade using a Rithmic API — confirm that it does not repaint.
Relying on repainted indicators for execution leads to false expectations, poor risk-reward profiles, and missed opportunities. Understanding how these indicators behave and testing them thoroughly is crucial for serious futures traders.
If you’re building or sourcing custom indicators and want help ensuring they’re suitable for real-time trading, the PickMyTrade support team is here to assist.
Need help automating your non-repainting strategy with Rithmic?
Contact PickMyTrade and streamline your futures execution with confidence.
References like close[1], high[2] actually refer to historical bars in pinescript, not future bars. The current bar is close[0] or just close. Am I missing something here?